The Supervisor Dashboard displays summaries, statistics, and charts.
Who Has Access
The Supervisor Dashboard option is available to anyone with access to the admin interface. However, the Learner Engagement, Account Summary, Monthly Enrollments sections of the Supervisor Dashboard will only contain data for the users listed below.
The following users have access to view data in the Supervisor Dashboard:
Users with the Group Manager group permission.
Users with the View Learner Results group permission.
Supervisors, if any of the account's Supervisor Access settings are checked.
Course managers, if the account's Course Manager Access setting's Report on Enrollments option is checked.
Viewing the Supervisor Dashboard
To view the Supervisor Dashboard
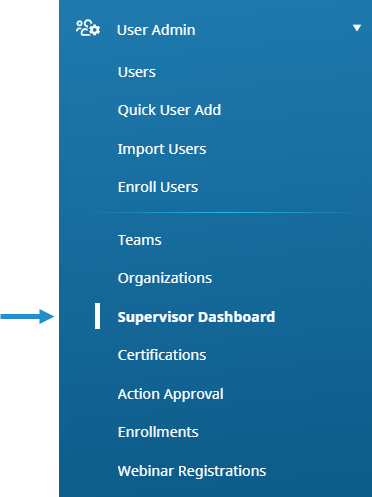
From the Admin menu, select User Admin.
Select Supervisor Dashboard.
The Supervisor Dashboard is the home page for users who have either the Group Manager (GM) or View Learner Results (VLR) group permission when the Default Landing Page for GM Users or VLR Users account settings is set to Supervisor Dashboard. If the account's Supervisor Access setting's Report on Supervisees option is checked, it will also be the home page for supervisors.
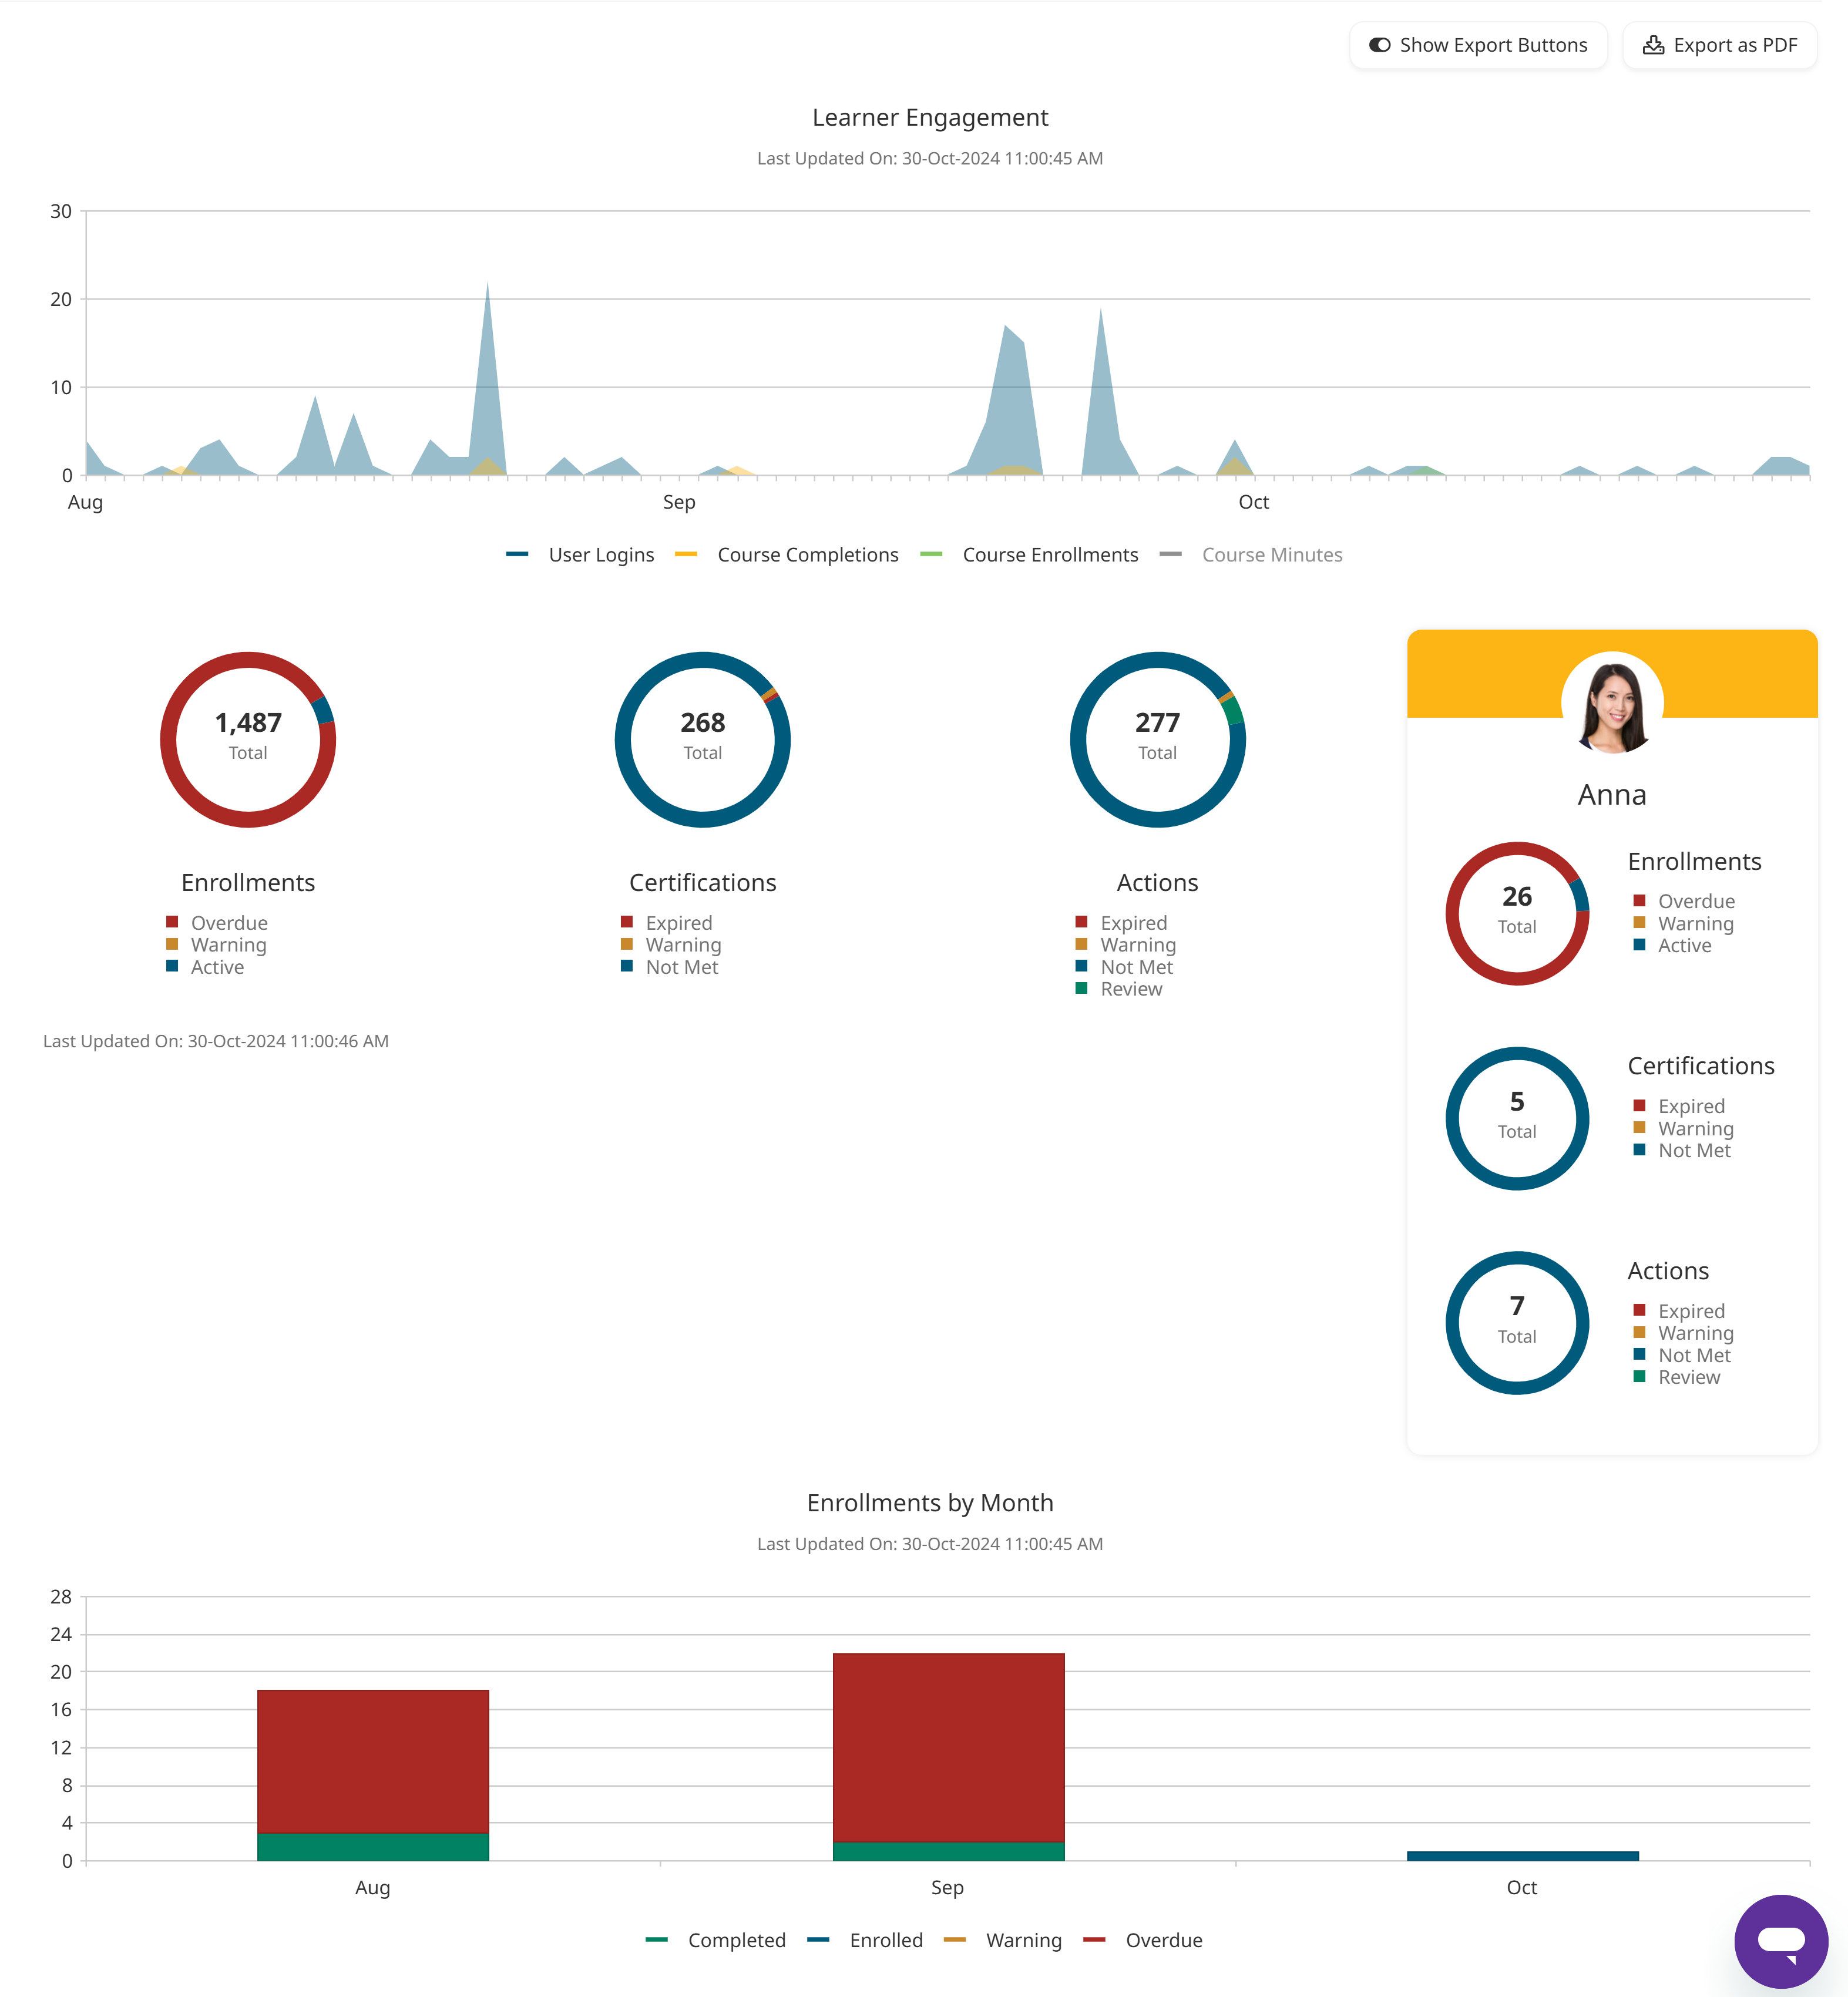
The Supervisor Dashboard displays with the following sections:
Account Summary (see note)
User Summary (see note)
The Account Summary and User Summary sections will NOT display if the account's Enable Slim Admin Dashboard setting is checked.
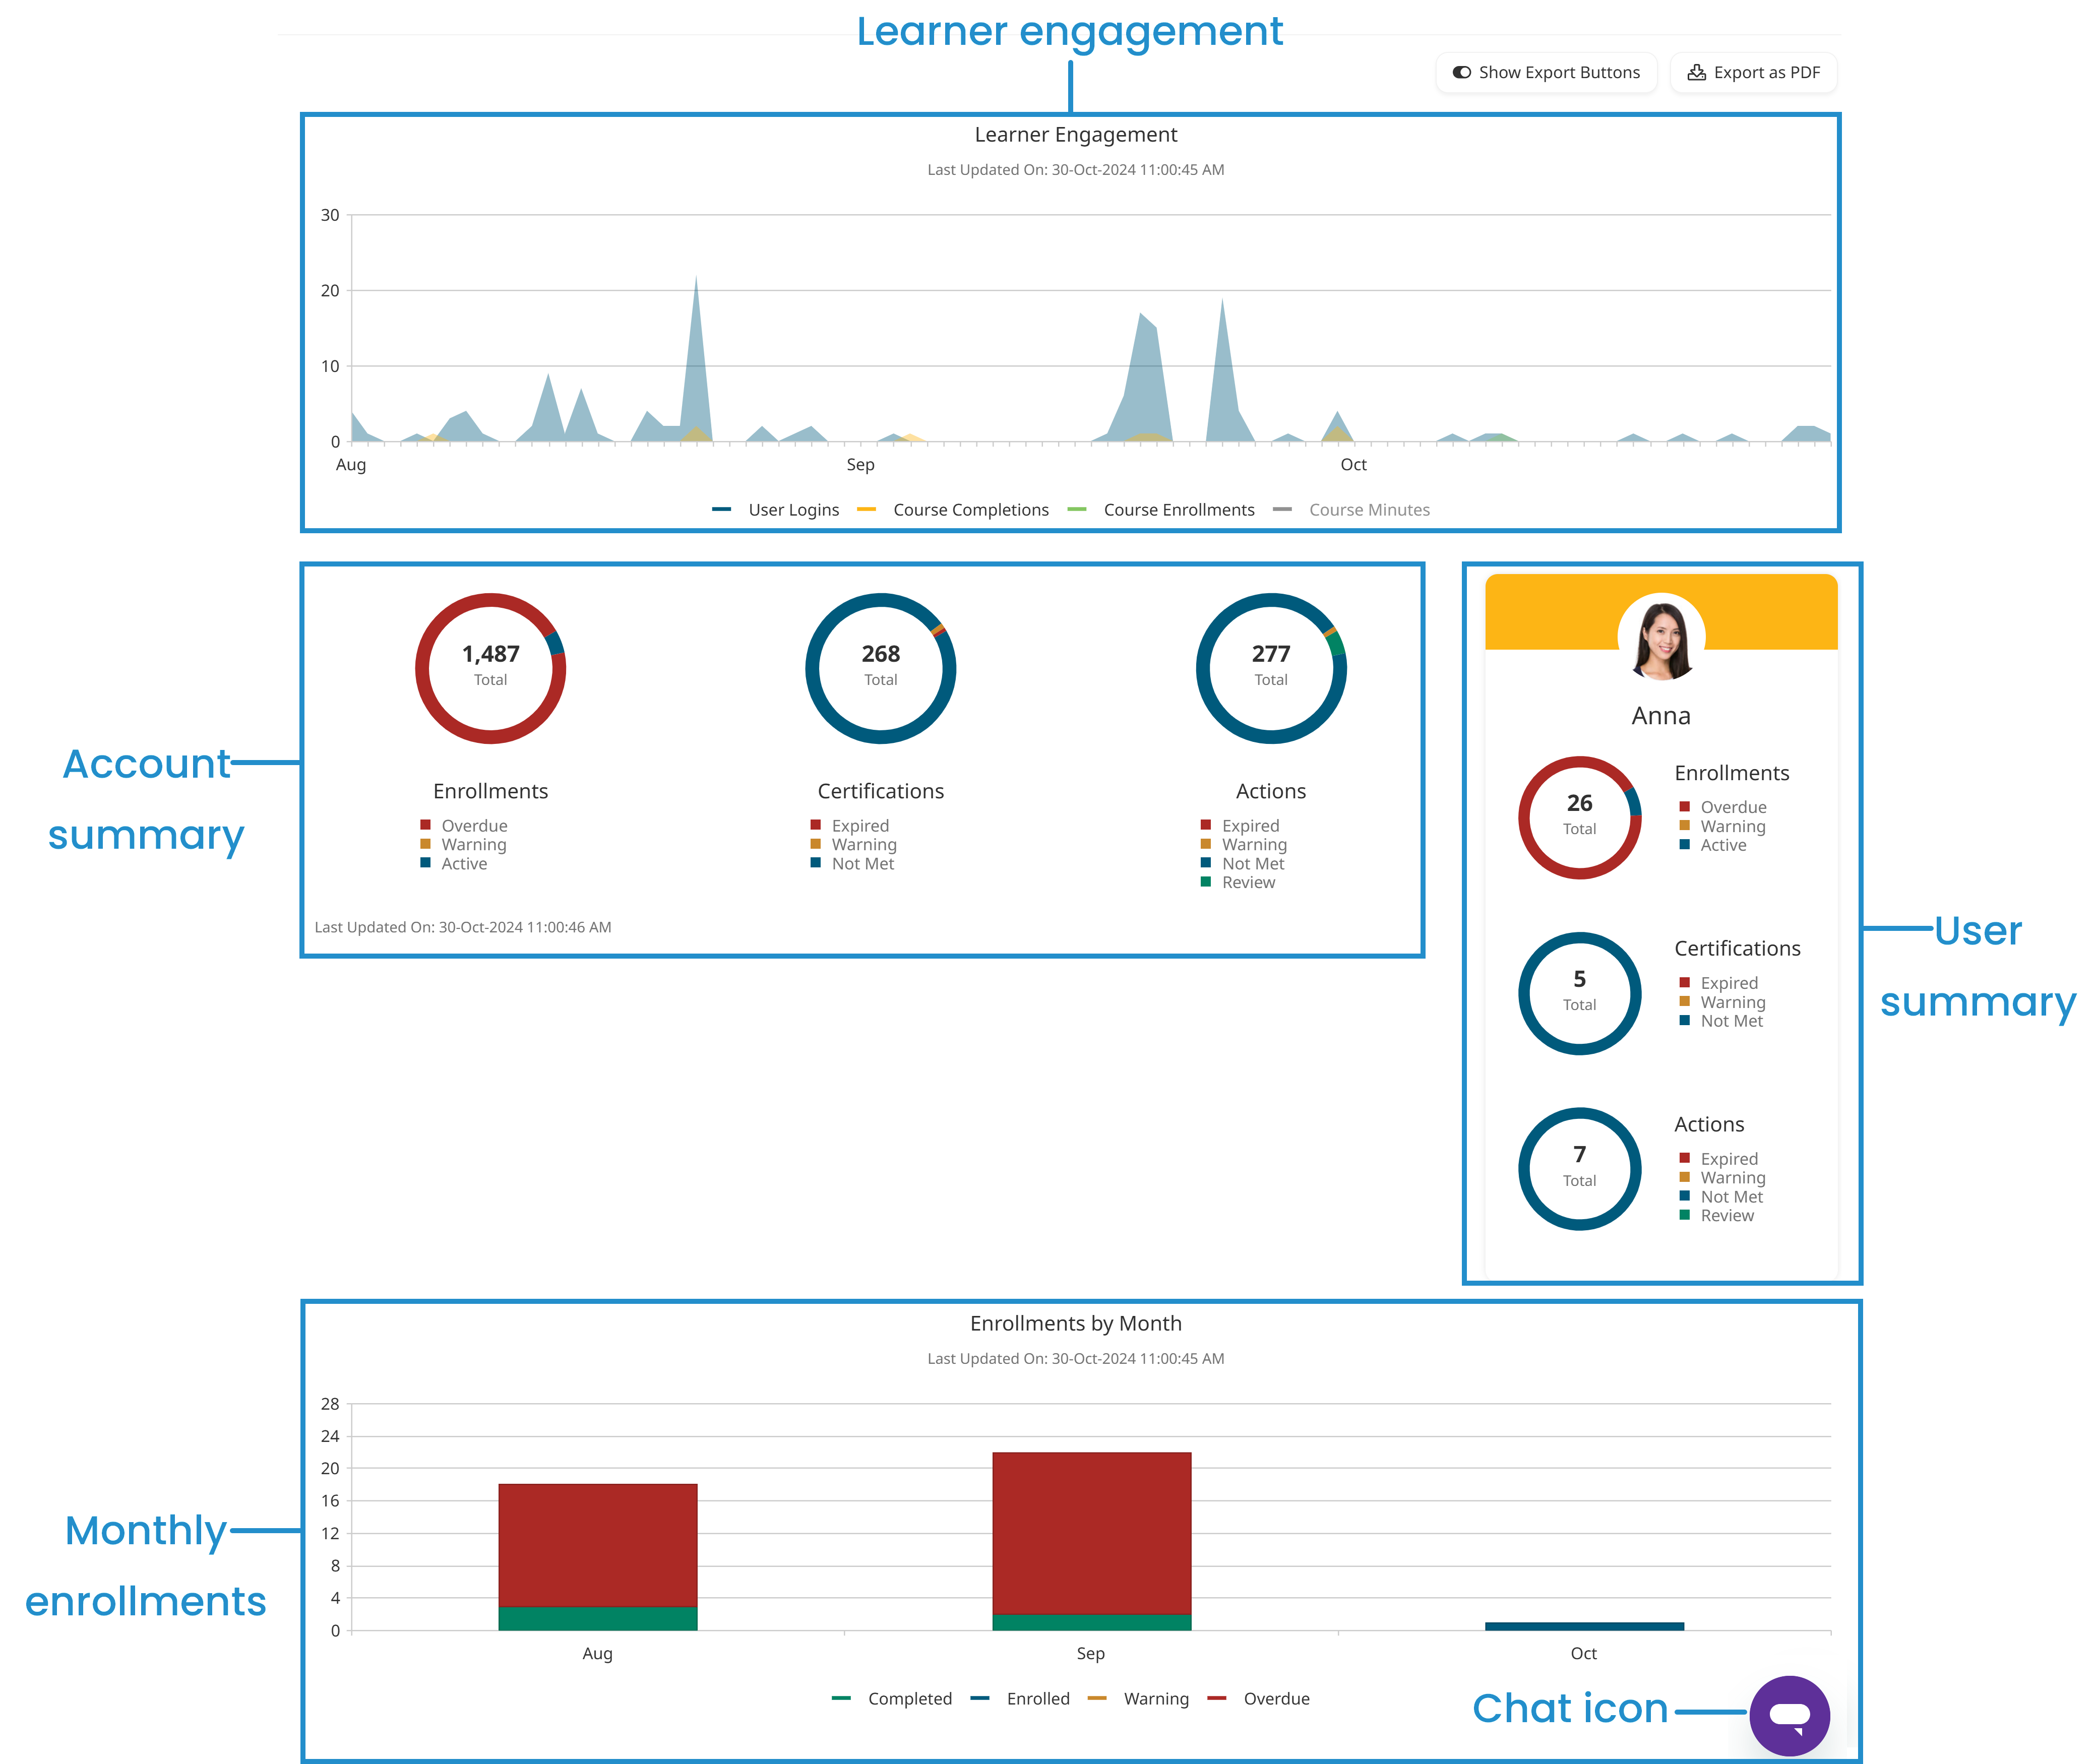
There are also buttons for exporting the contents of the Supervisor Dashboard.
Learner Engagement
The Learner Engagement section displays a chart of the number of user logins, course completions, course enrollments, and number of minutes spent in a course by month. The chart only includes information for groups or users to which you have reporting permission.
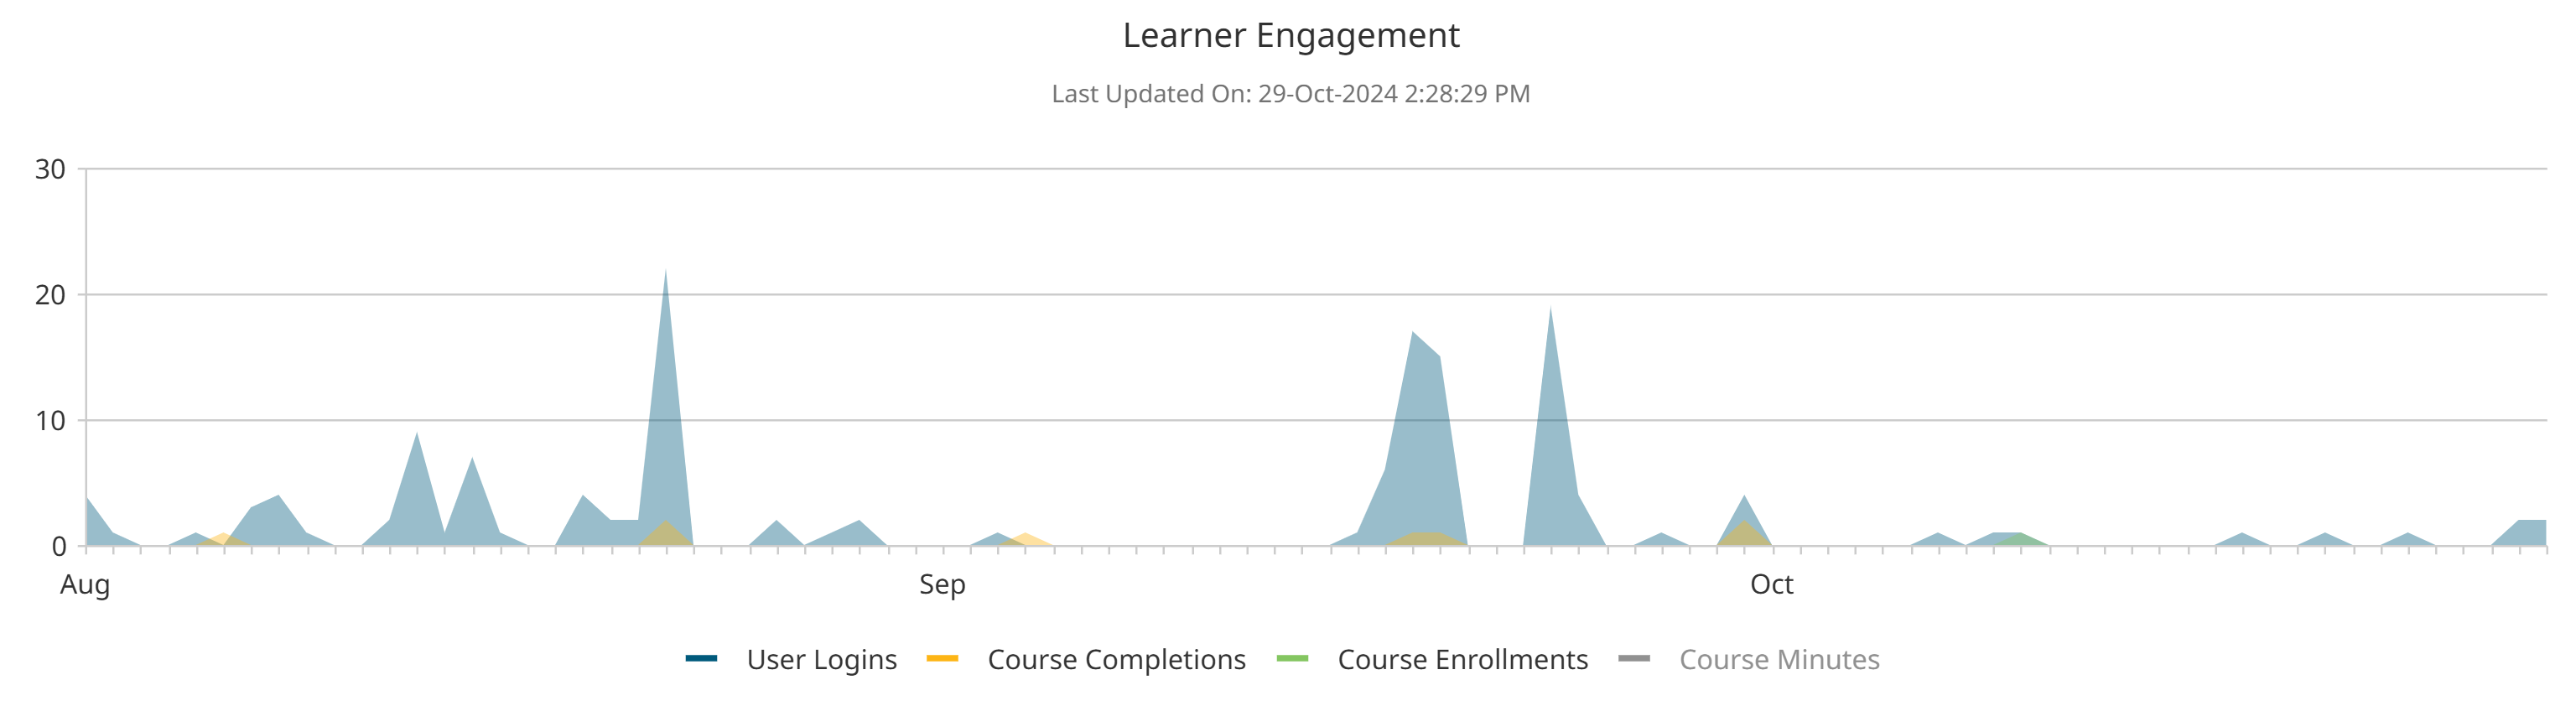
The current month displays on the far right side of the chart. To the left of the current month, the chart displays data for the last three months.
To view the details for a data point, hover over the data point on the chart.
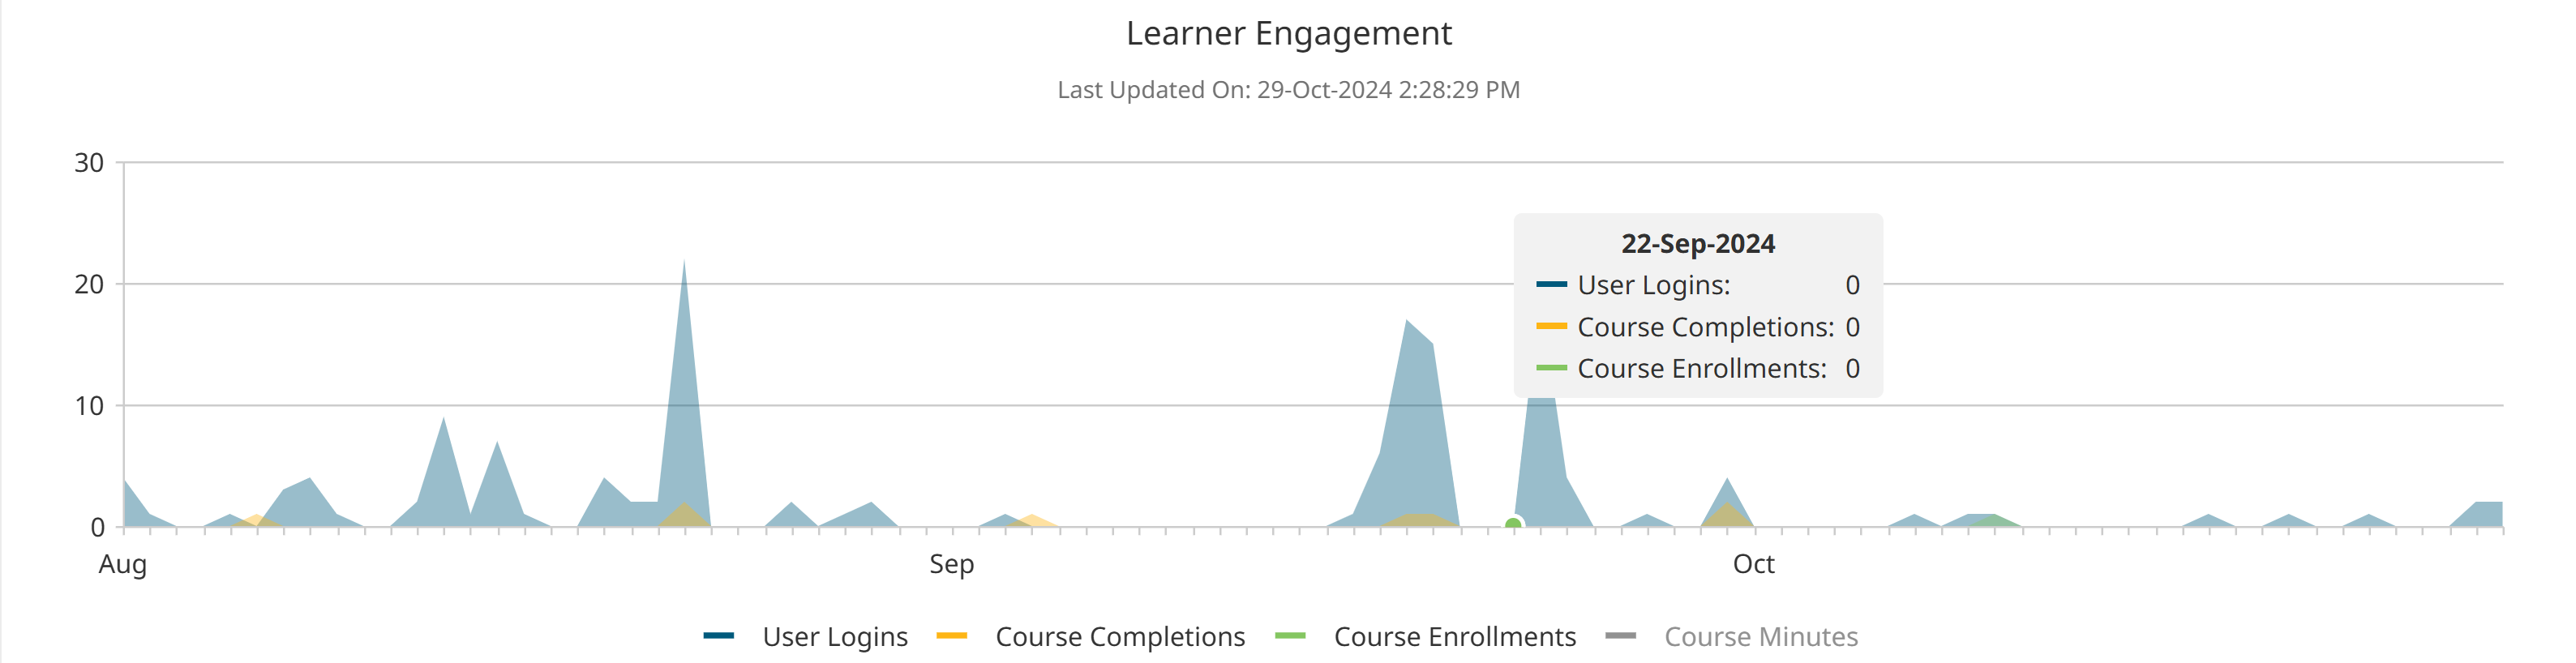
You can control which data series is displayed on the chart by clicking on the legend to show or hide the data series. When a data series is hidden its label in the legend displays in gray.
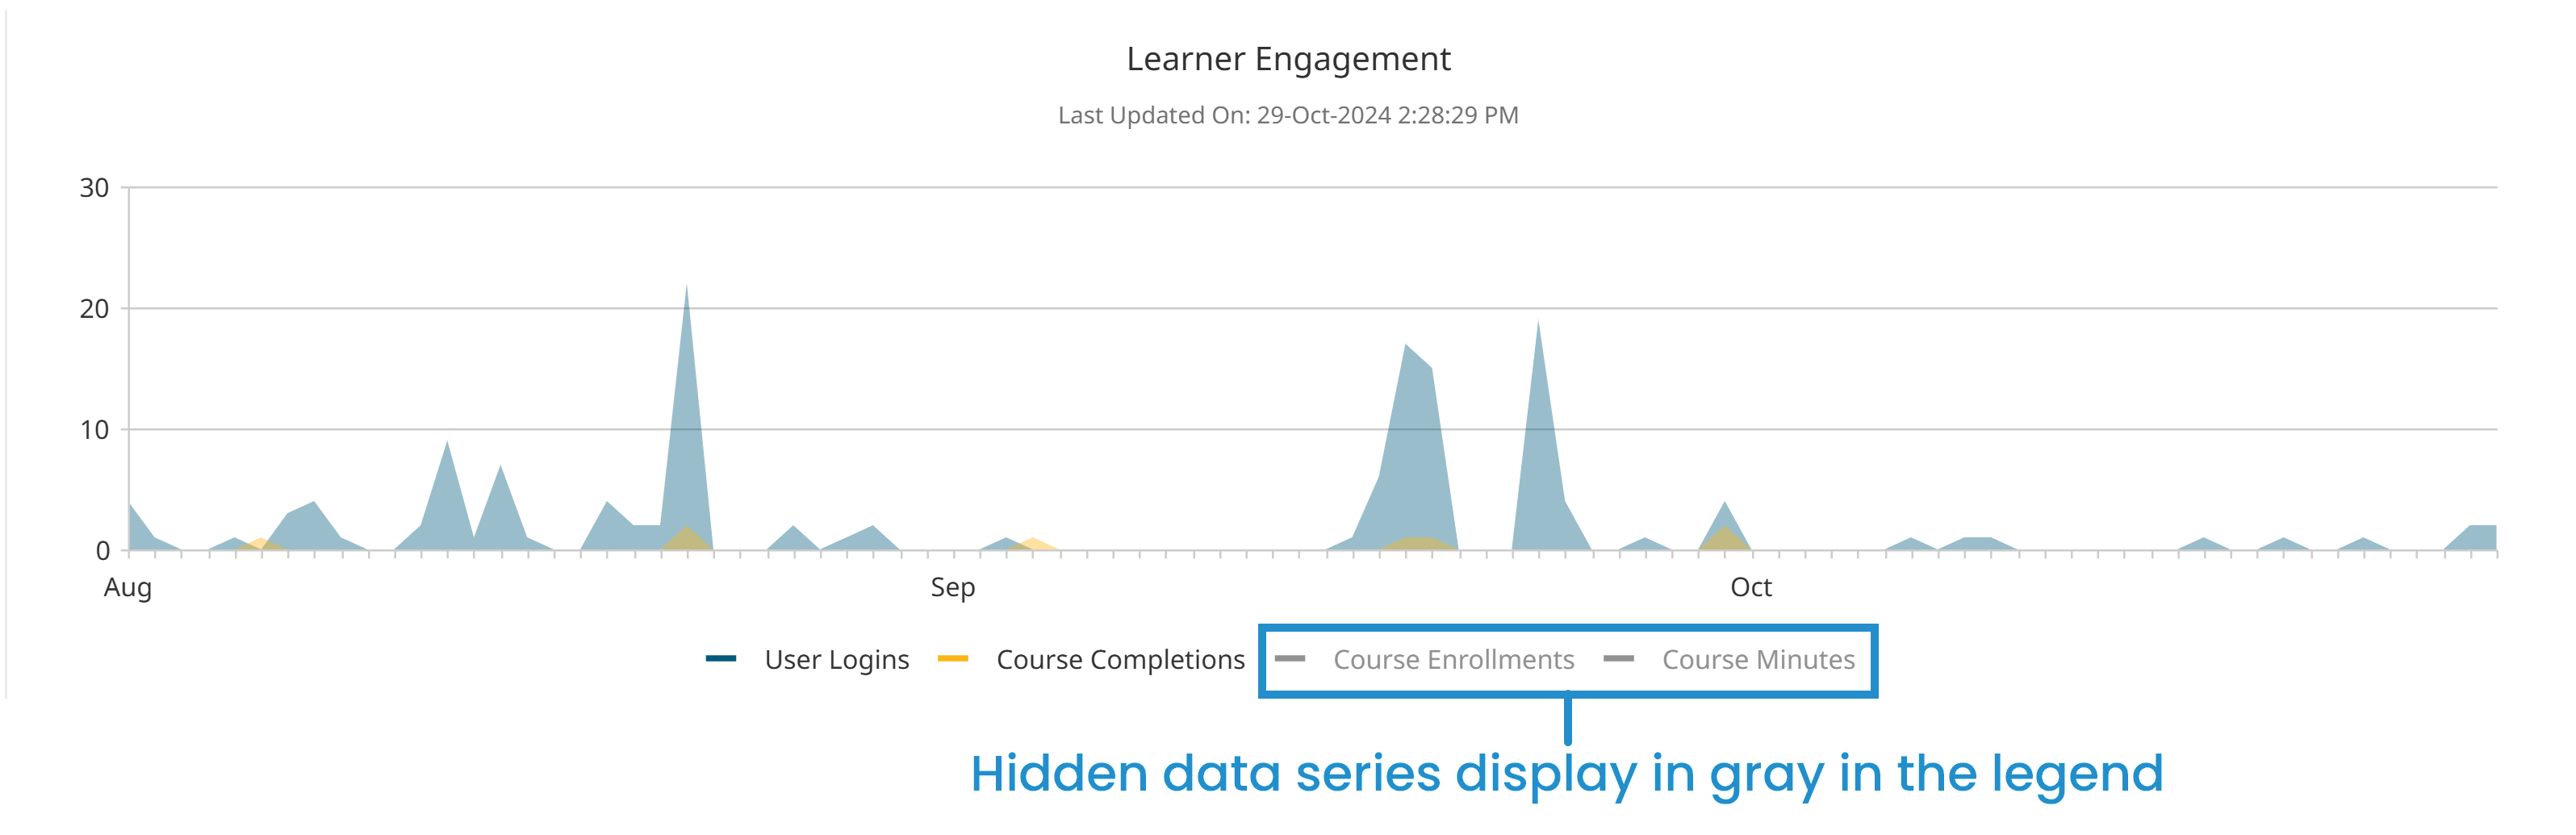
As you show/hide data series on the chart, the range displayed on the vertical axis changes to reflect the range of the displayed data series.
Account Summary
This section only displays when the account's Enable Slim Admin Dashboard setting is NOT checked.
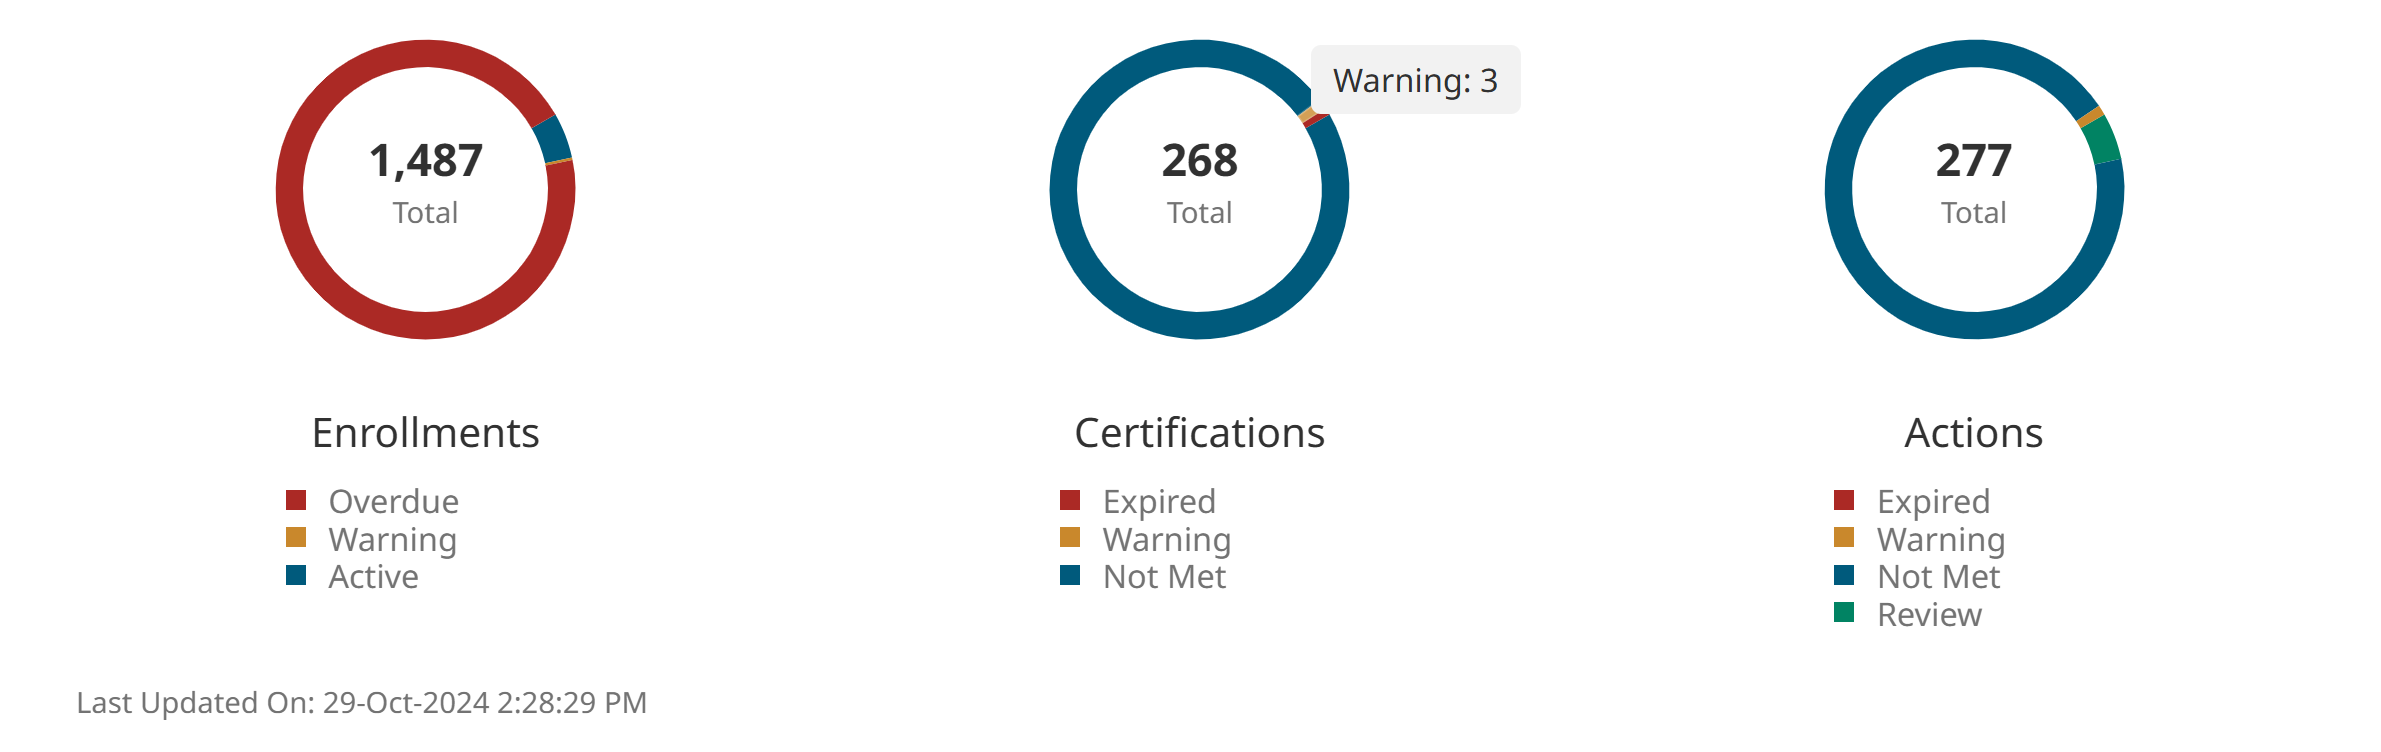
The Account Summary section displays a summary of the enrollments, certifications, and actions that are not yet completed by status. The charts only include information for groups or users to which you have reporting permission.
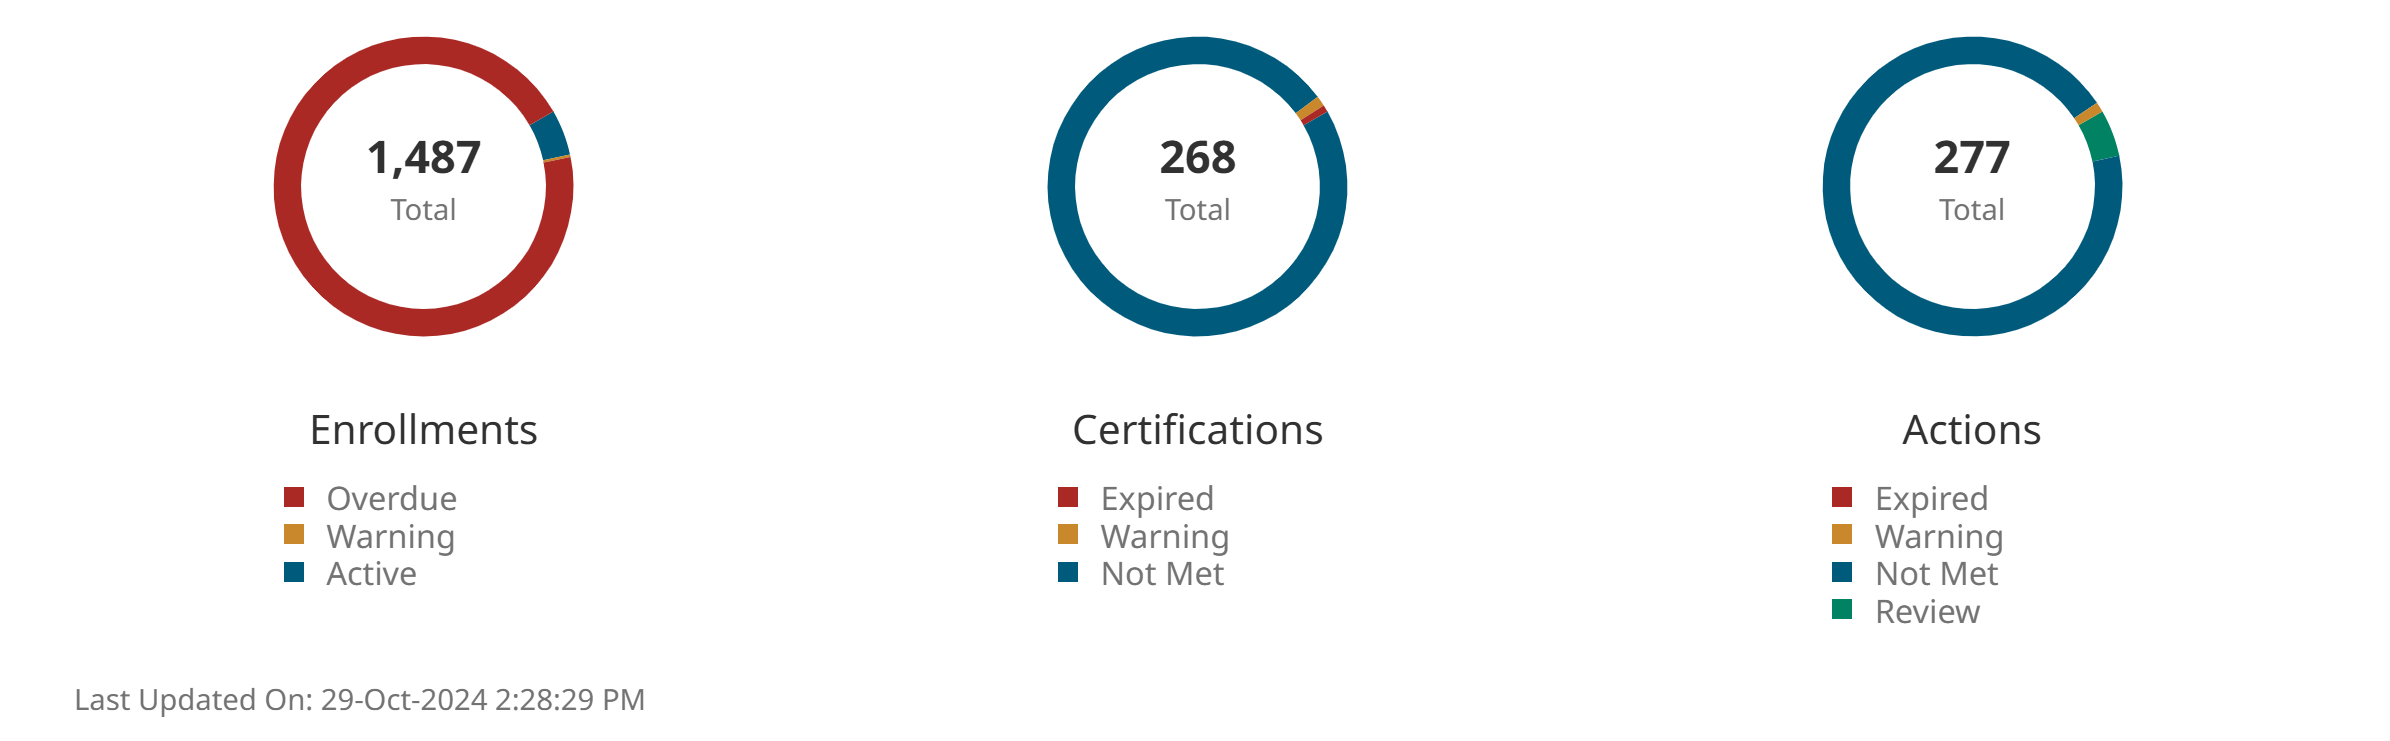
To view the details for a chart's segment, hover over the segment. You can view a pre-filtered Enrollment Report or Certifications Dashboard by clicking on a chart's segment.
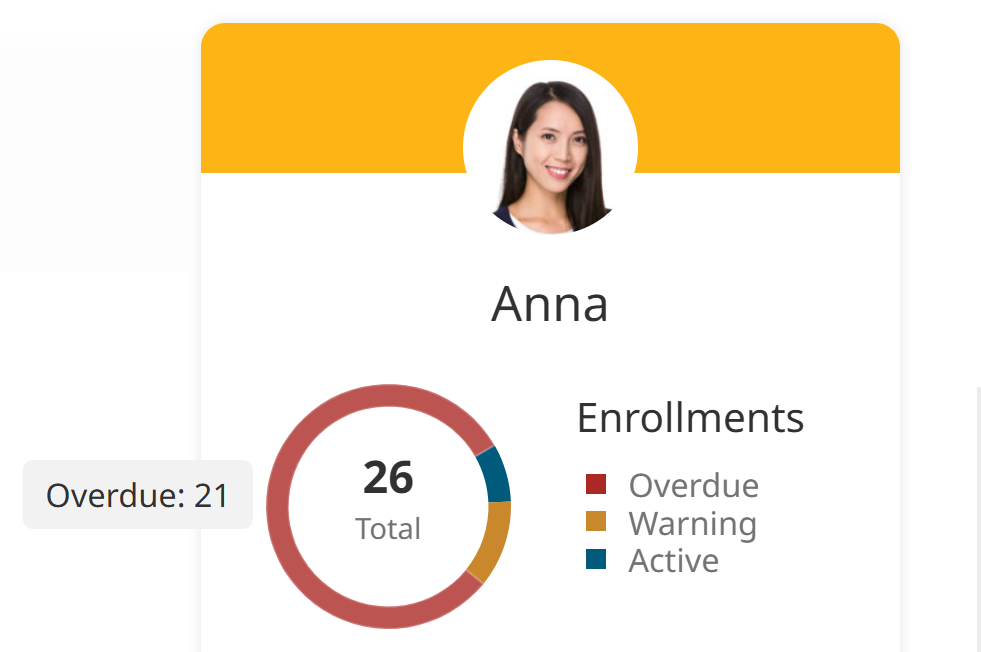
User Summary
This section only displays when the account's Enable Slim Admin Dashboard setting is NOT checked.
The User Summary section displays a summary of your enrollments, certification, and actions by status below your profile picture.
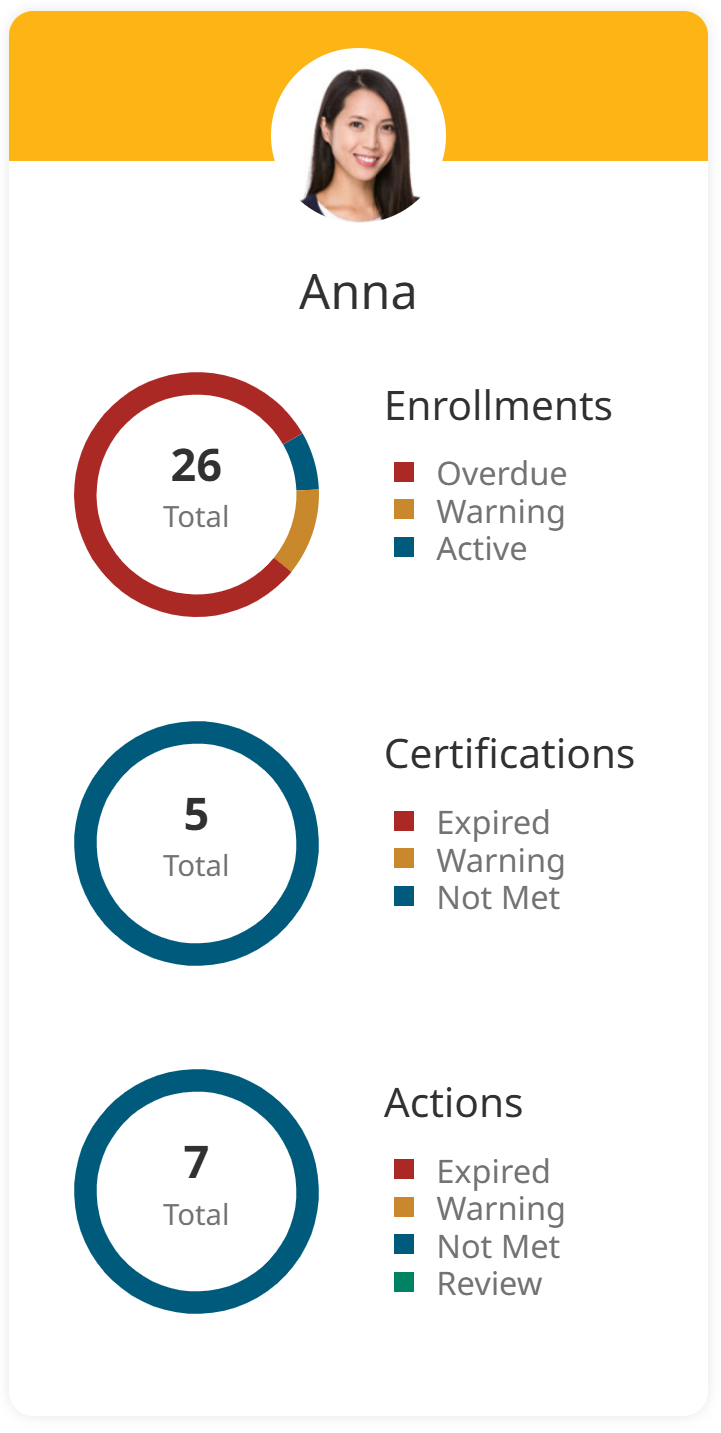
Like the account charts, this section only includes enrollments, certifications, and actions that are not yet completed.
To view the details for a chart's segment, hover over the segment.
Statuses Included
The Account Summary and User Summary sections include the following enrollment, certification, and action statuses.
Enrollments
Statuses included:
Overdue - The number of course enrollments that learners have started, but have exceeded the amount of time allotted to complete the course.
Warning - The number of course enrollments that learners have started, but not finished although over 75% of the allotted completion time for the course has passed.
Active - The number of course enrollments that learners have started and are less than 75% through the allotted completion time of the course.
Certifications
Statuses included:
Expired - The number of certifications that were previously completed by learners, but have now expired.
Warning - The number of certifications that are within the warning period of one or more associated requirements.
Not Met - The number of certifications that have never been completed by learners.
Actions
Statuses included:
Expired - The number of actions that were previously completed by learners, but have now expired.
Warning - The number of actions that are within the warning period of one or more associated requirements.
Not Met - The number of actions that have never been completed by learners.
Review - The number of actions that are waiting for activity from a user other than the learner to which the action was assigned. For example, this would include an action that requires confirmation from a learner's supervisor.
Monthly Enrollments
The Monthly Enrollments section displays a stacked bar chart with the number of enrollments by month with the current status of the enrollment indicated by color. The chart only includes information for groups or users to which you have reporting permission.
The current month displays on the far right side of the chart. To the left of the current month, the chart displays data for the last three months.
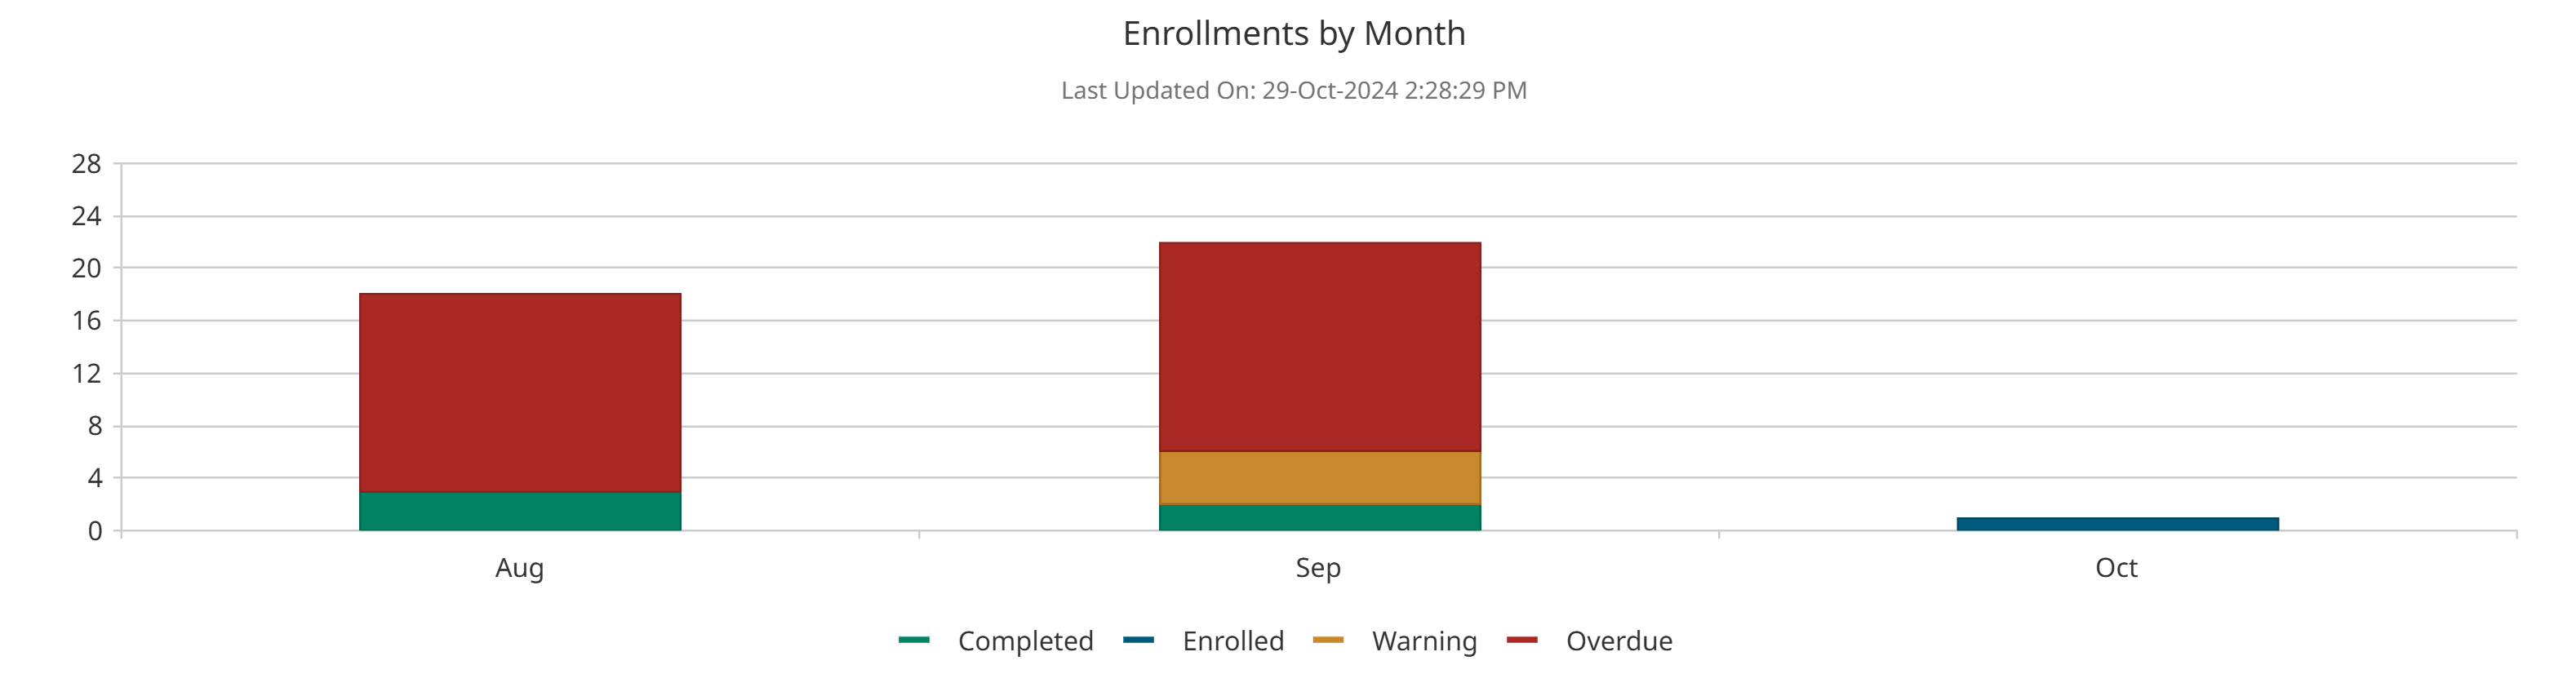
You can hover over a month's bar to view the details for that month.
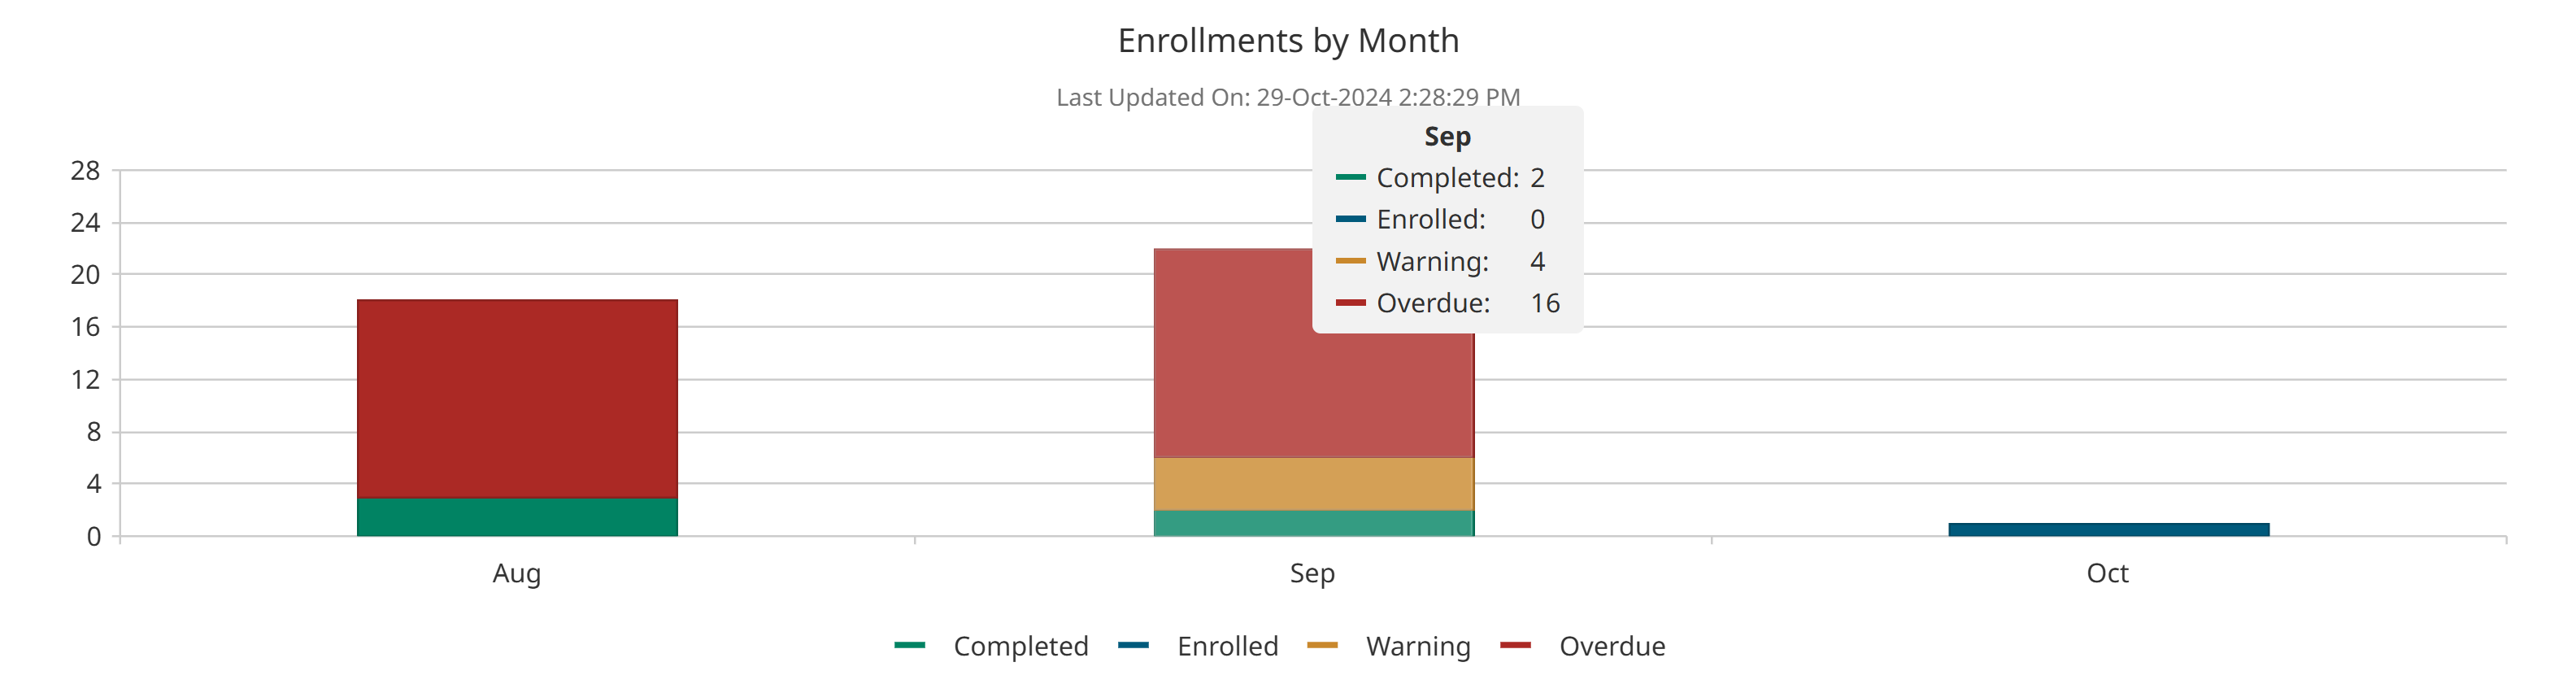
You can control which data series is displayed on the chart by clicking on the legend to show or hide the data series. When a data series is hidden its label in the legend displays in gray.
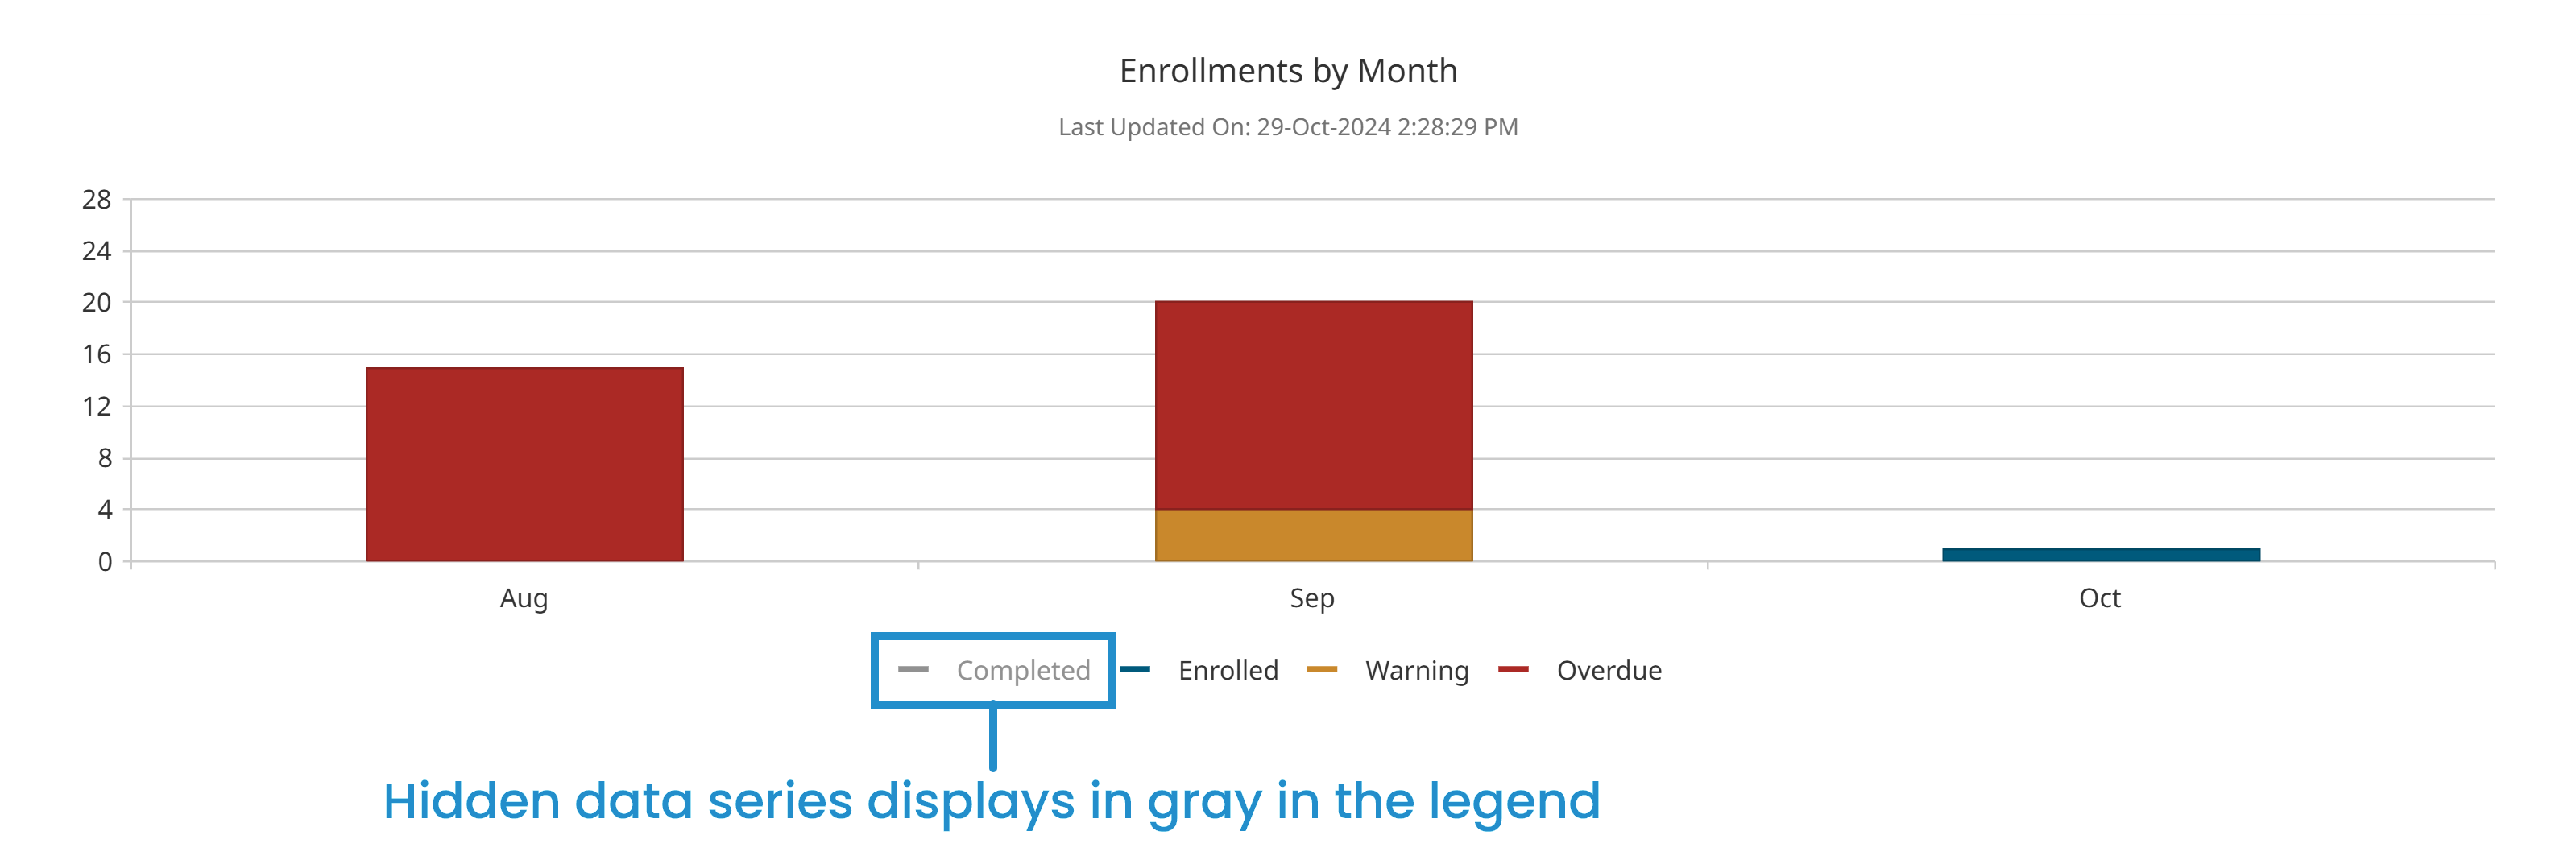
As you show/hide data series on the chart, the range displayed on the vertical axis changes to reflect the range of the displayed data series.