Learner Summary pages enable you to view a summary of your enrollments, certification, and actions by their status, as well as charts that summarize your engagement and enrollments.
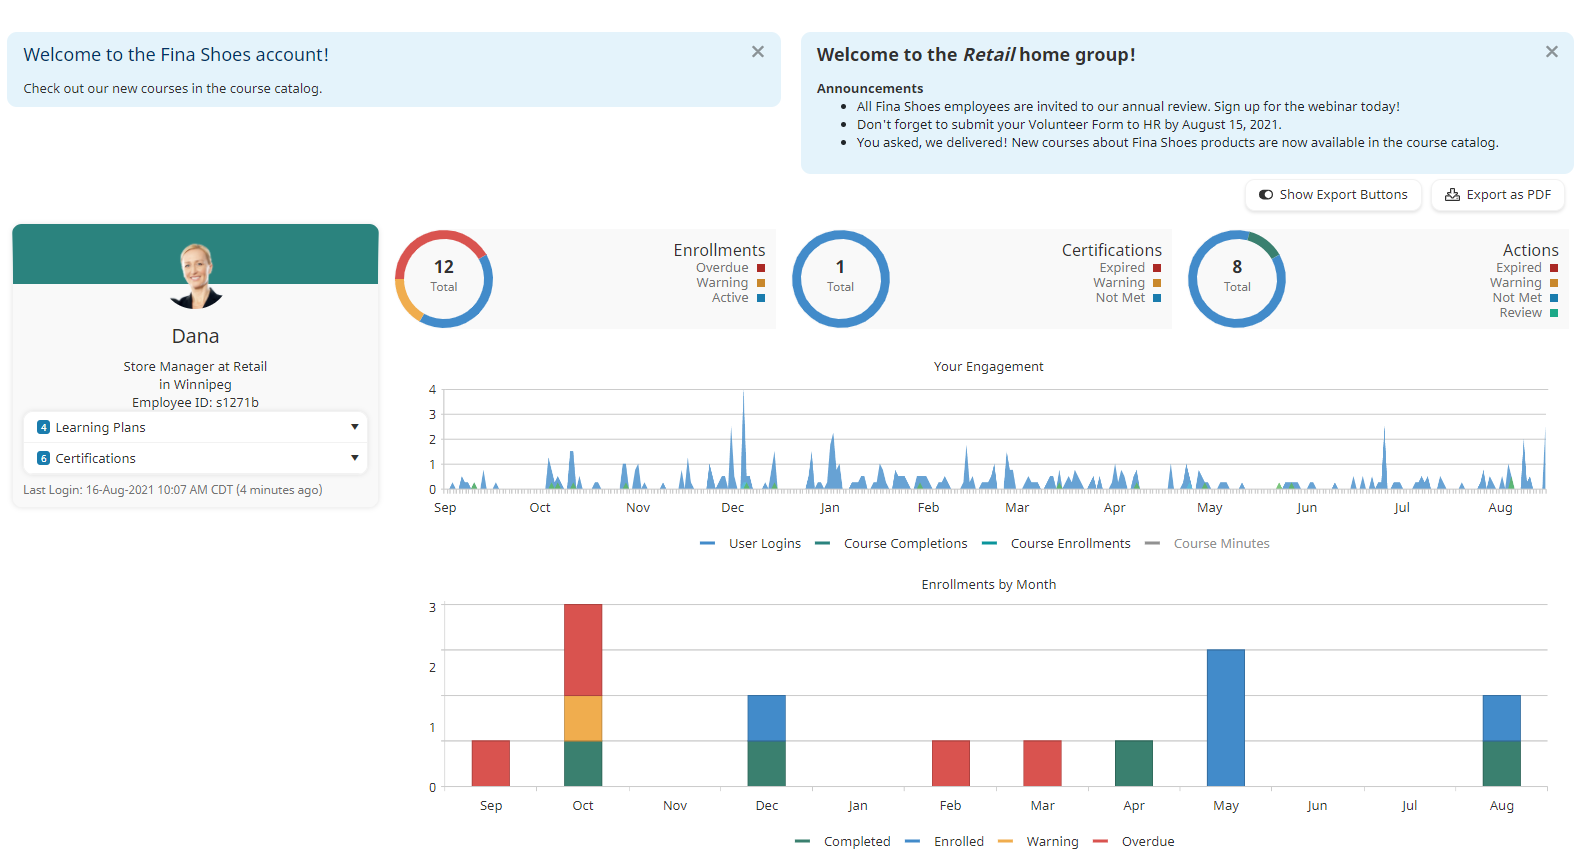
Learner Summary pages display the following sections:
Contact Card
Your contact card displays your name, title, division, location, and employee ID.

Your learning plans and certifications are listed below your information. Click the arrow beside each to view the learning plans and certifications assigned to you.

Each learning plan and certification is color-coded to indicate its status.
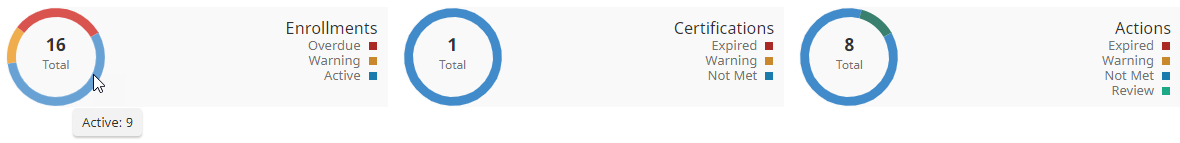
User Summary
The User Summary section displays donut charts that summarize your enrollments, certification, and actions by status.

You can hover over a chart to view a segment's details.
Learner Engagement
The Learner Engagement section is a graphical representation of your logins, course completions, course enrollments, and number of minutes spent in courses by month.
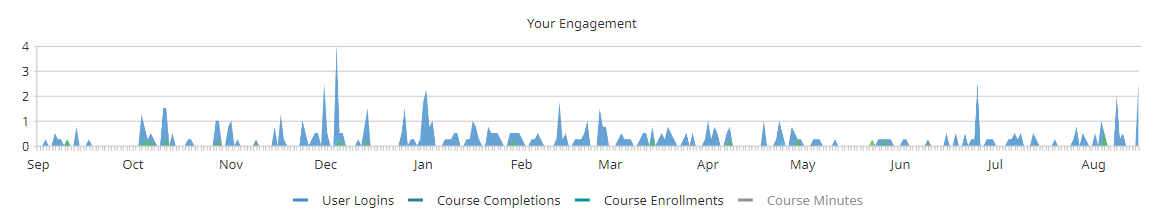
The current month displays on the far right side of the chart. To the left of the current month, the chart displays data for the last 12 months.
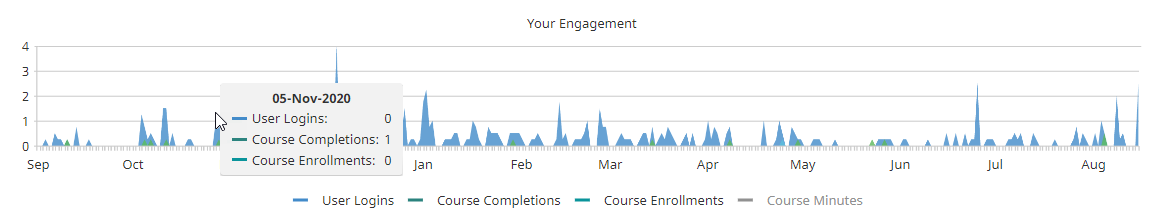
To view the details for a data point, hover over the data point on the chart.
You can control which data series is displayed on the chart by clicking on the legend to show or hide the data series. When a data series is hidden its label in the legend displays in gray.
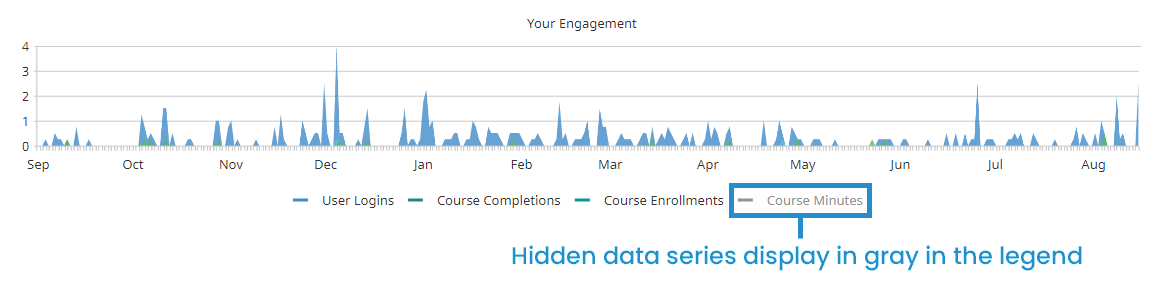
As you show/hide data series on the chart, the range displayed on the vertical axis changes to reflect the range of the displayed data series.
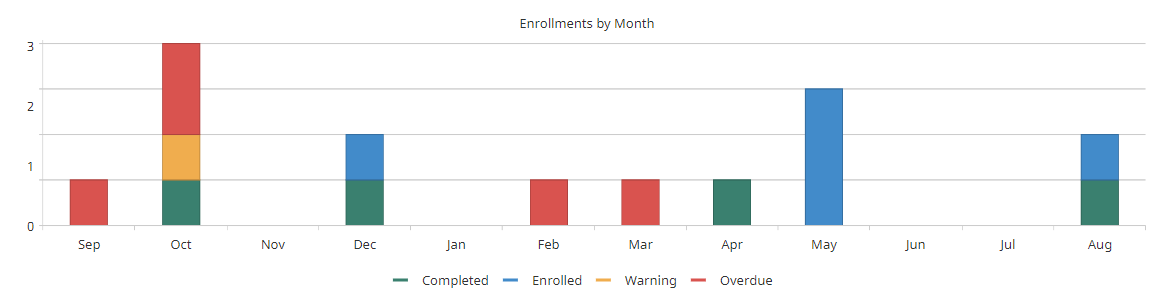
Monthly Enrollments
The Monthly Enrollment section displays a stacked bar chart that displays the number of your enrollments by month with the current status of the enrollment indicated by color. The current month displays on the far right side of the chart. To the left of the current month, the chart displays data for the last 12 months.
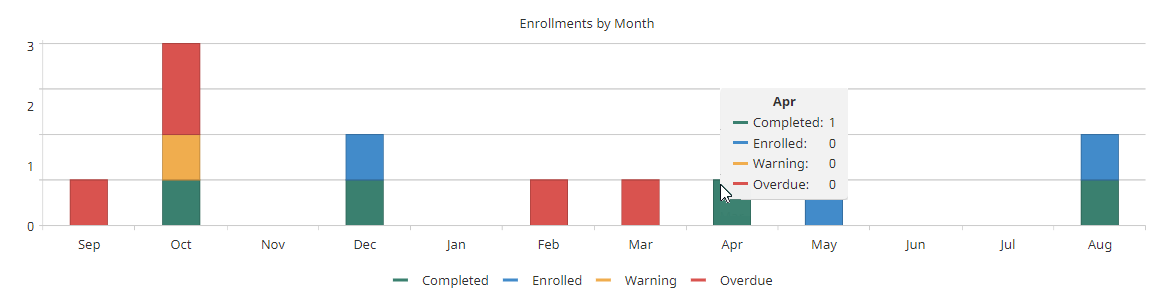
You can hover a month's bar to view the details for that month.
You can control which data series is displayed on the chart by clicking on the legend to show or hide the data series. When a data series is hidden its label in the legend displays in gray.
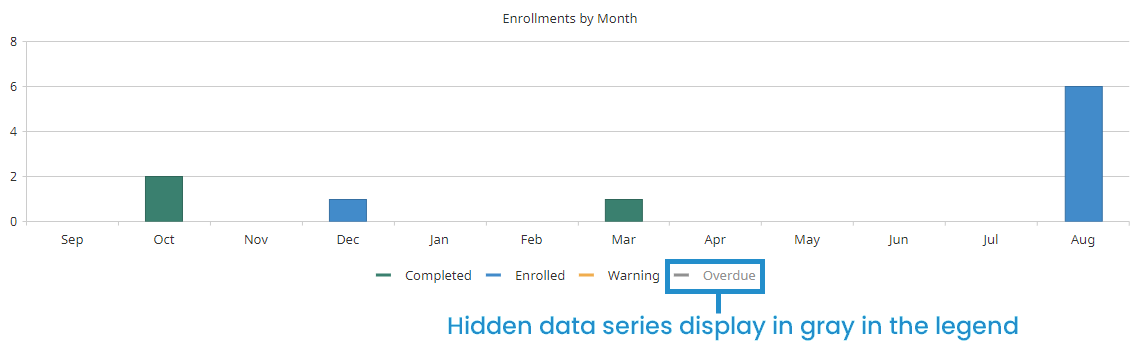
As you show/hide data series on the chart, the range displayed on the vertical axis changes to reflect the range of the displayed data series.