Everyone reports to someone, and getting to the data we need and then analyzing it correctly is an ongoing challenge we all share. We know that reporting is essential to any effective training program. Metrics help us track key performance indicators (KPIs), identify successes (and failures), and demonstrate measurable results to stakeholders. With the right metrics, we can quickly spot potential gaps in our training processes and find ways to optimize training delivery in our LMS systems.
SmarterU LMS gives you access to a wide range of metrics and the ability to run several unique reports. Depending on the type of report you run, you’ll first need to decide if you want to run a default or custom report. What does this mean? When should you run a default report? A custom report? Keep reading for the answers to these questions and more.
Default Reports in SmarterU
SmarterU’s default reports are quick and easy to run. They come pre-populated with everything you need to generate a simple report and apply common filters.
For example, using SmarterU’s default Enrollment Report, you can see a learner's enrolled courses or view all of the courses they completed during a specific date range.
One advantage to running a default report is that it can save you a lot of setup time. Because default reports come pre-defined, you don’t need to add filters or grid columns individually. All you need to do is fill in the details you need and hit “run.” Default reports also tend to be a lot more intuitive for novice users.
A default report is typically your best option when you need to quickly report on a general metric — such as a specific user’s course enrollments.
Custom Reports in SmarterU
While default reports are quick and easy to run, they achieve this by limiting what you can do. Custom reports give you complete control and allow you to create reports specifically tailored to your unique needs.
When running a custom report, you can add the exact filters you want — including filters that are unavailable when running a default report — and customize your report output. While default reports always present the report in a grid with pre-selected columns, custom reports allow you to customize these only to show the most relevant information. Custom reports also give you the option to generate reports that include charts.
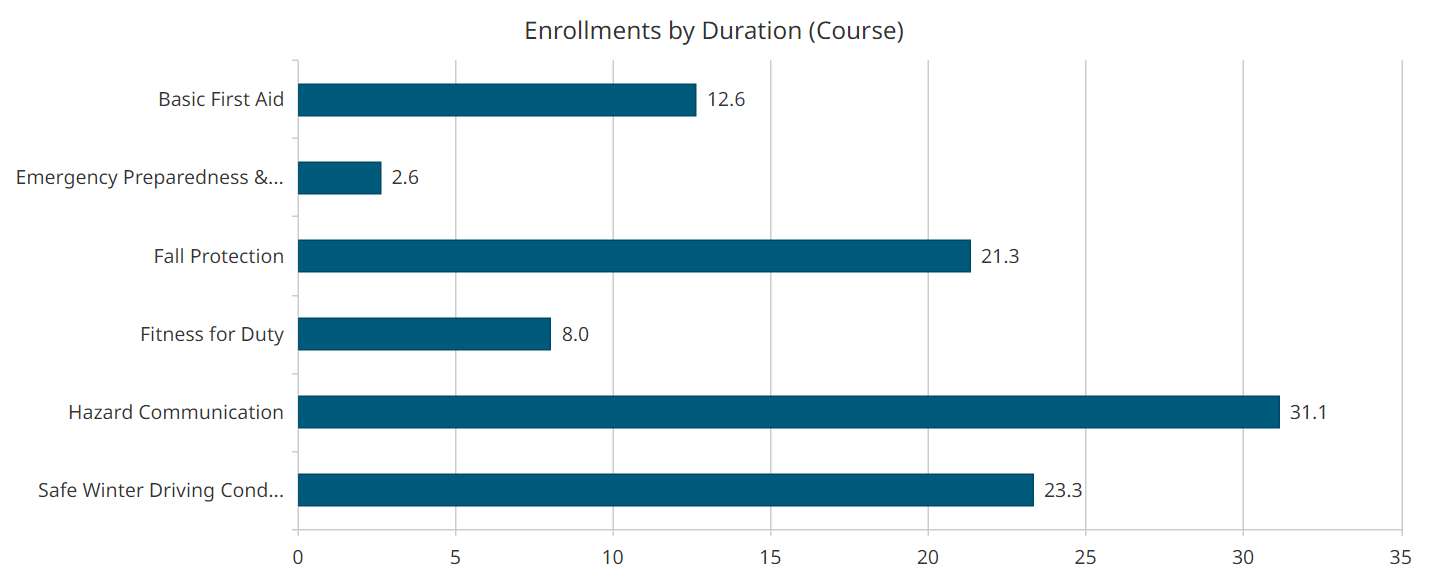
For example, using SmarterU’s custom Enrollment Report, you can generate a report that shows how many points a learner earned for each of their completed courses. Further, you can customize the report to show specific columns and include a chart showing time spent in each course.
While custom reports give you a lot more control and flexibility, they do take more time to set up. With that said, you can save time by saving the custom reports you use regularly or scheduling them to run automatically. (Check out our article, Schedule Reports to Send Automatically, to learn more!)
A custom report is your best option when you need to report on a particular metric, want to customize the grid columns in your report, or generate a chart.
Example: The Enrollment Report
Let’s look at an example of a report that has both default and custom options: SmarterU’s Enrollment Report. This report allows you to see what courses your learners have been enrolled in and track their progress.
This example will help illustrate when you want to use a default versus a custom report.
Running the Default Enrollment Report
Let’s imagine we want to generate a quick report showing all of the courses that one of our learners, Anya Havrylyuk, has been assigned.
To run a default Enrollment Report, follow these steps:
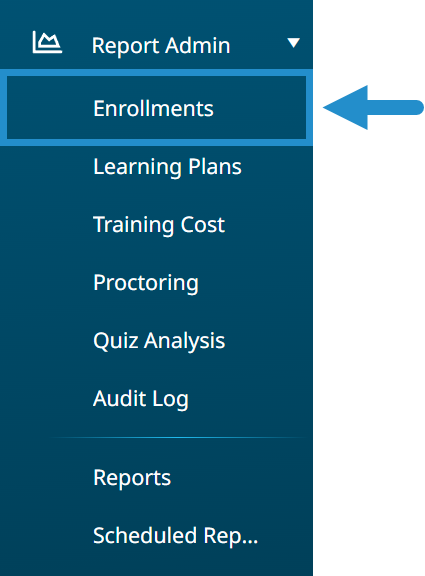
- Select Report Admin in the menu.
- Click Enrollments to open the default Enrollment Report.
As you can see, the Enrollment report already has a bunch of filters pre-selected.
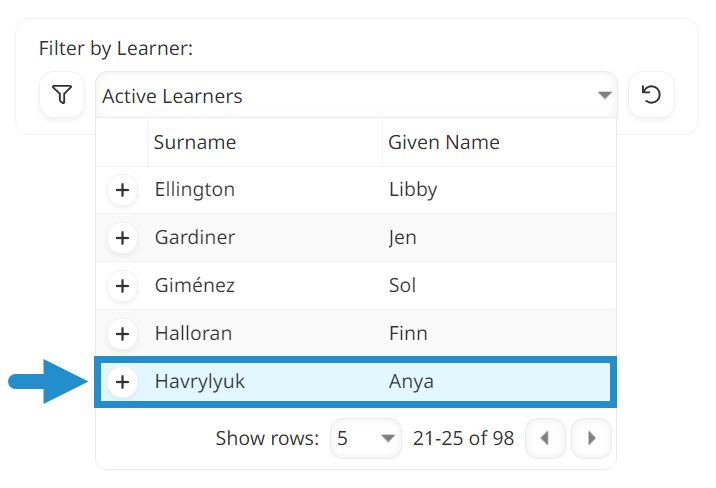
- Find the Filter by Learner filter.
- Select Anya’s name from the dropdown menu.
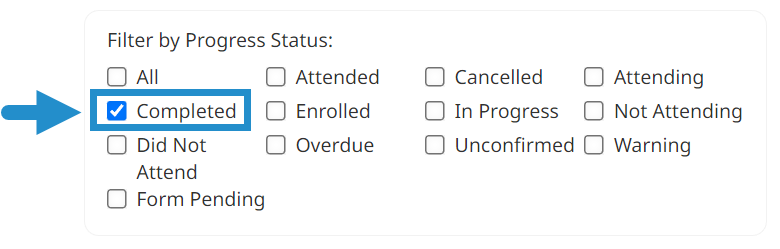
- Find the Filter by Progress Status filter.
- Select Completed.
- Click Run Report.
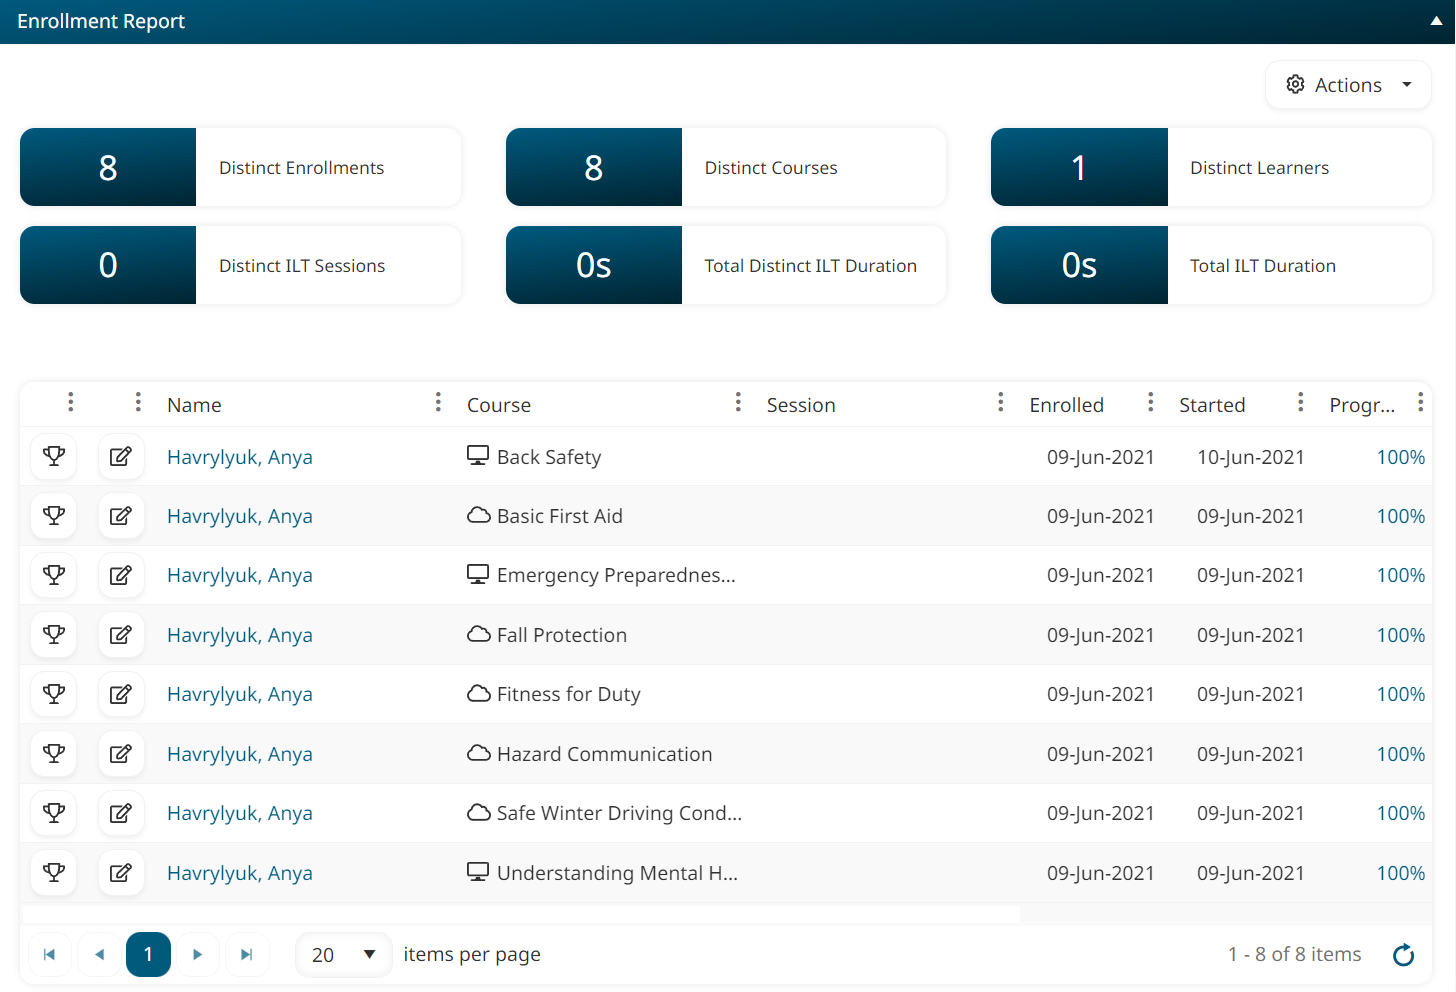
With only a few clicks, we can see all of the courses Anya has completed.
Running the Custom Enrollment Report
Now, let’s imagine that we want to go a step further and generate a report that shows all of the courses that Anya Havrylyuk has completed where she earned at least 1 point. We only want the report to include the following columns: Learner Name, Employee ID, Course Name, and Points Earned.
To run a custom Enrollment Report, follow these steps:
- Select Report Admin in the menu.
- Click Reports.
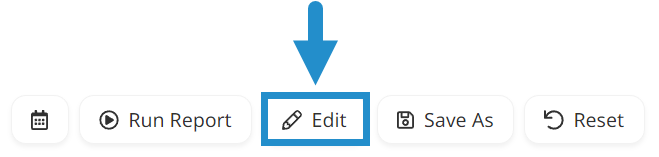
- At the top of the page, click +Enrollments to create a custom Enrollment Report.
- Give the report a name and description (optional).
- Open the Filters accordion.
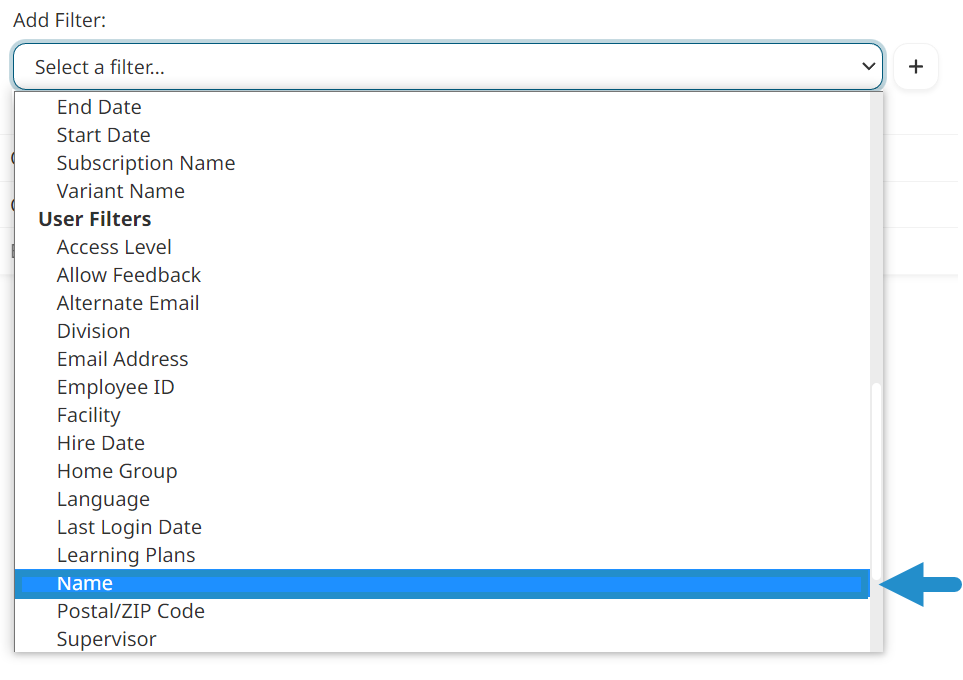
- From the dropdown menu, go to the Users Filters section and click Name.
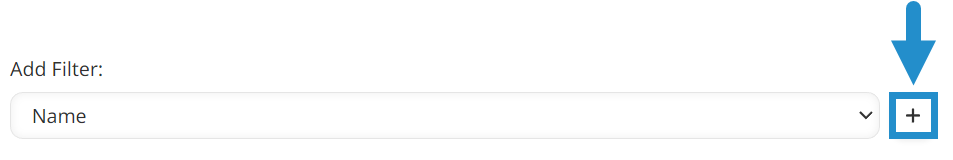
- Click + to add the filter.
- Select Anya’s name from the Filter by Learner dropdown menu.
- From the dropdown menu, go to the Course Filters section and click Points Earned.
- Click + to add the filter.
- In the Filter by Points Earned area, enter "1” in the first box.
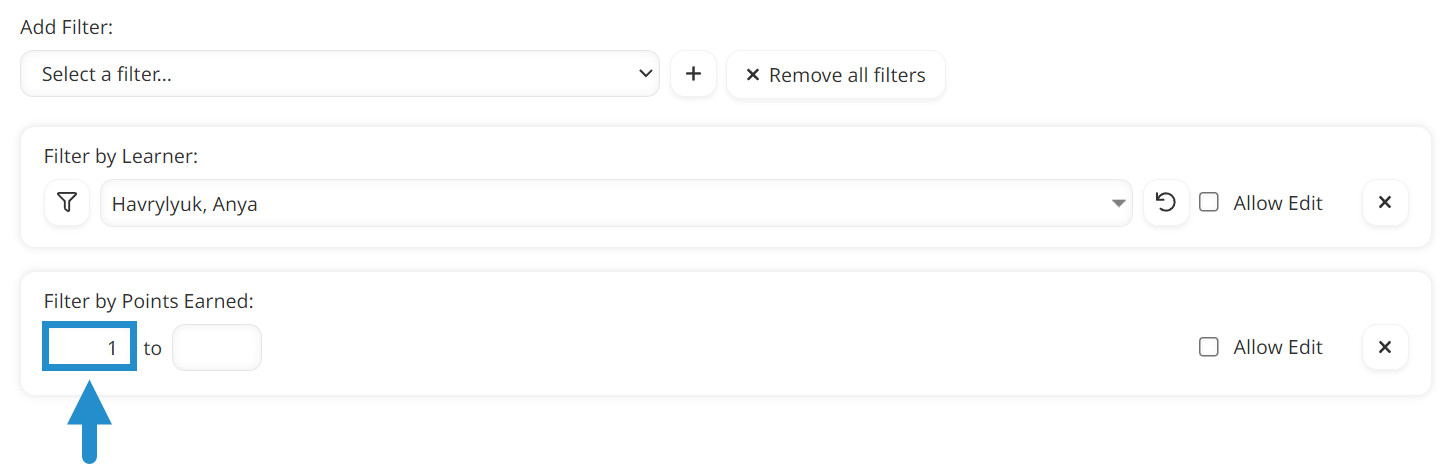
By leaving the second box empty, we are saying that we want to see any course where Anya earned one or more points (no maximum points value).
We do not have to add a separate filter for completed courses because Anya can only earn points for the courses she has completed.
- Open the Columns accordion.
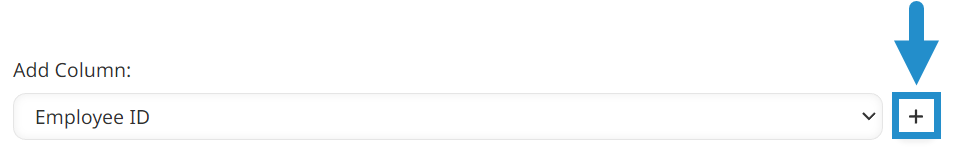
- From the dropdown menu, go to the Users Columns section and click Employee ID.
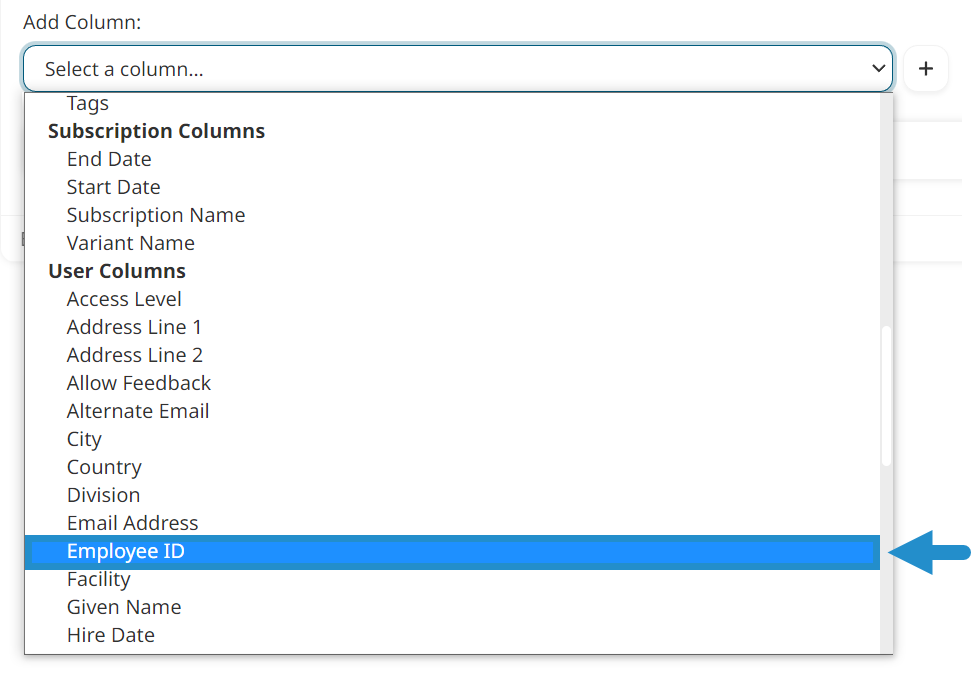
- Click + to add the column.
- From the dropdown menu, go to the Course Columns section and click Points Earned.
- Click + to add the filter.
- Use the drag icons to organize the columns into the desired order.
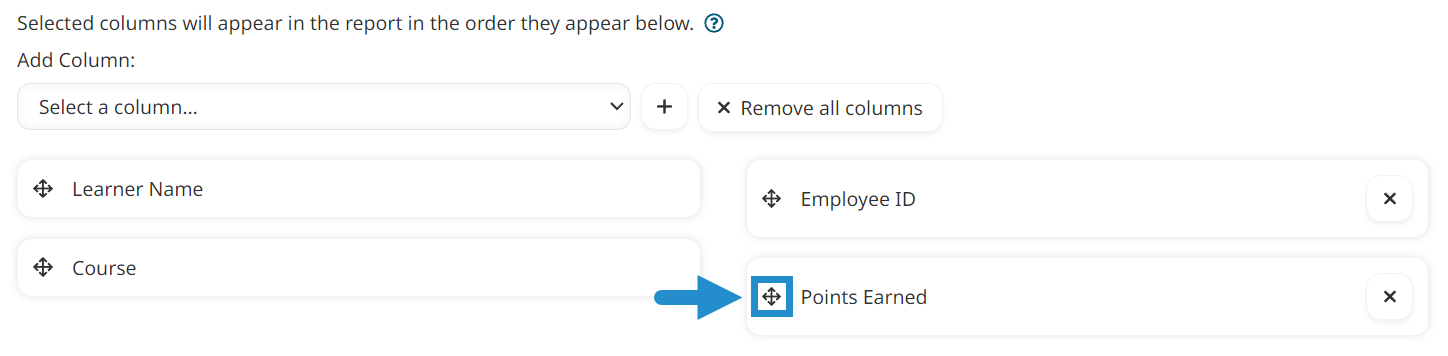
- Click Run Report.
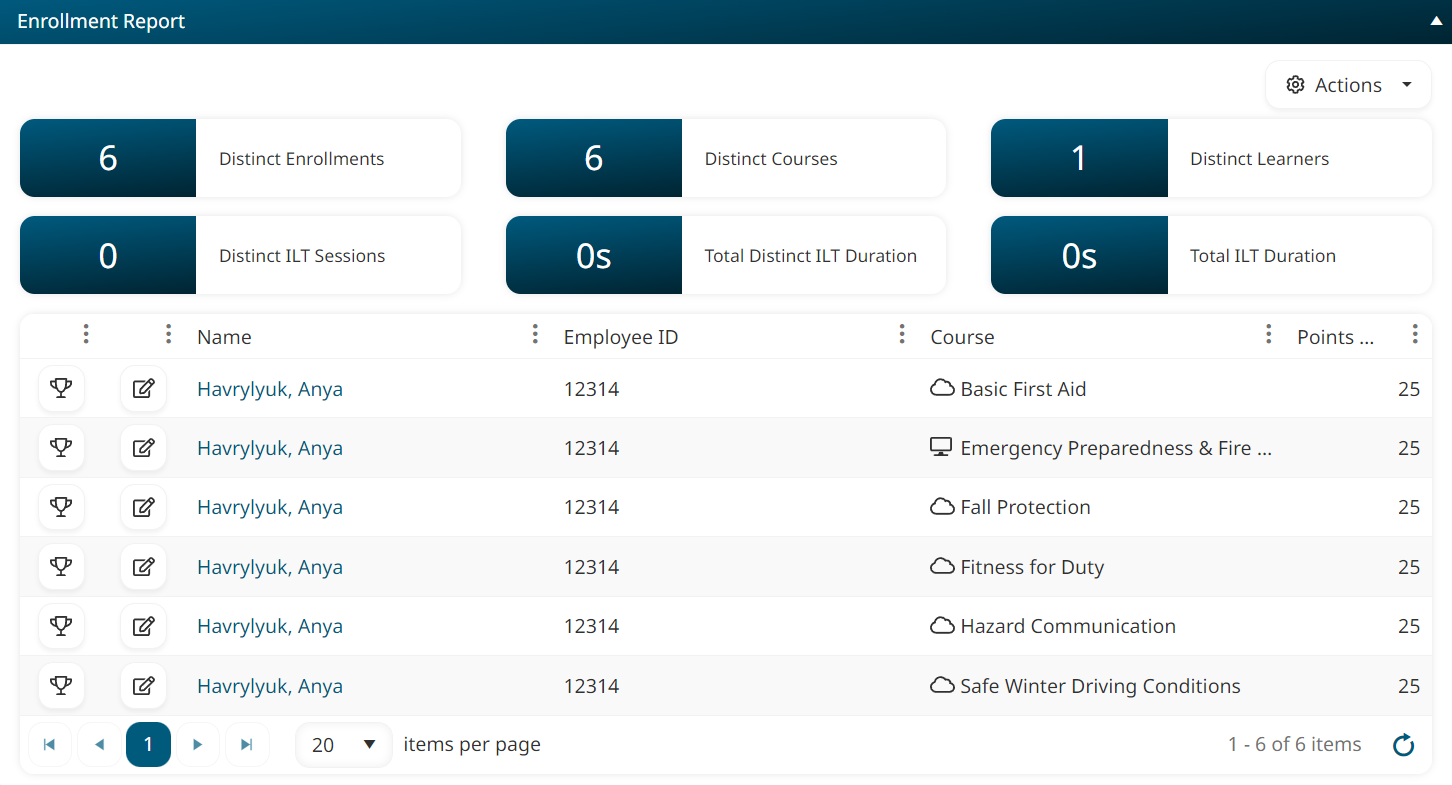
While this report required more setup, we could get the exact information we needed. By limiting the columns displayed, we also made it easier for others, such as Anya’s manager, to view the report and quickly see where she earned points. Creating a targeted report is especially helpful when sharing information with stakeholders and demonstrating your progress toward achieving a specific KPI.
Whether you run a default report for quick insight into learner activity, or a custom report for more granular control over data presentation, both reporting options provide valuable information that can help you better understand your training.