Custom Enrollment and custom Learning Plan Reports enable you to display the output in a chart. One of the chart options is a bar chart.
Bar charts show display rectangular bars with lengths proportional to the values that they represent. The example below shows the number of enrollments grouped by enrollment date.
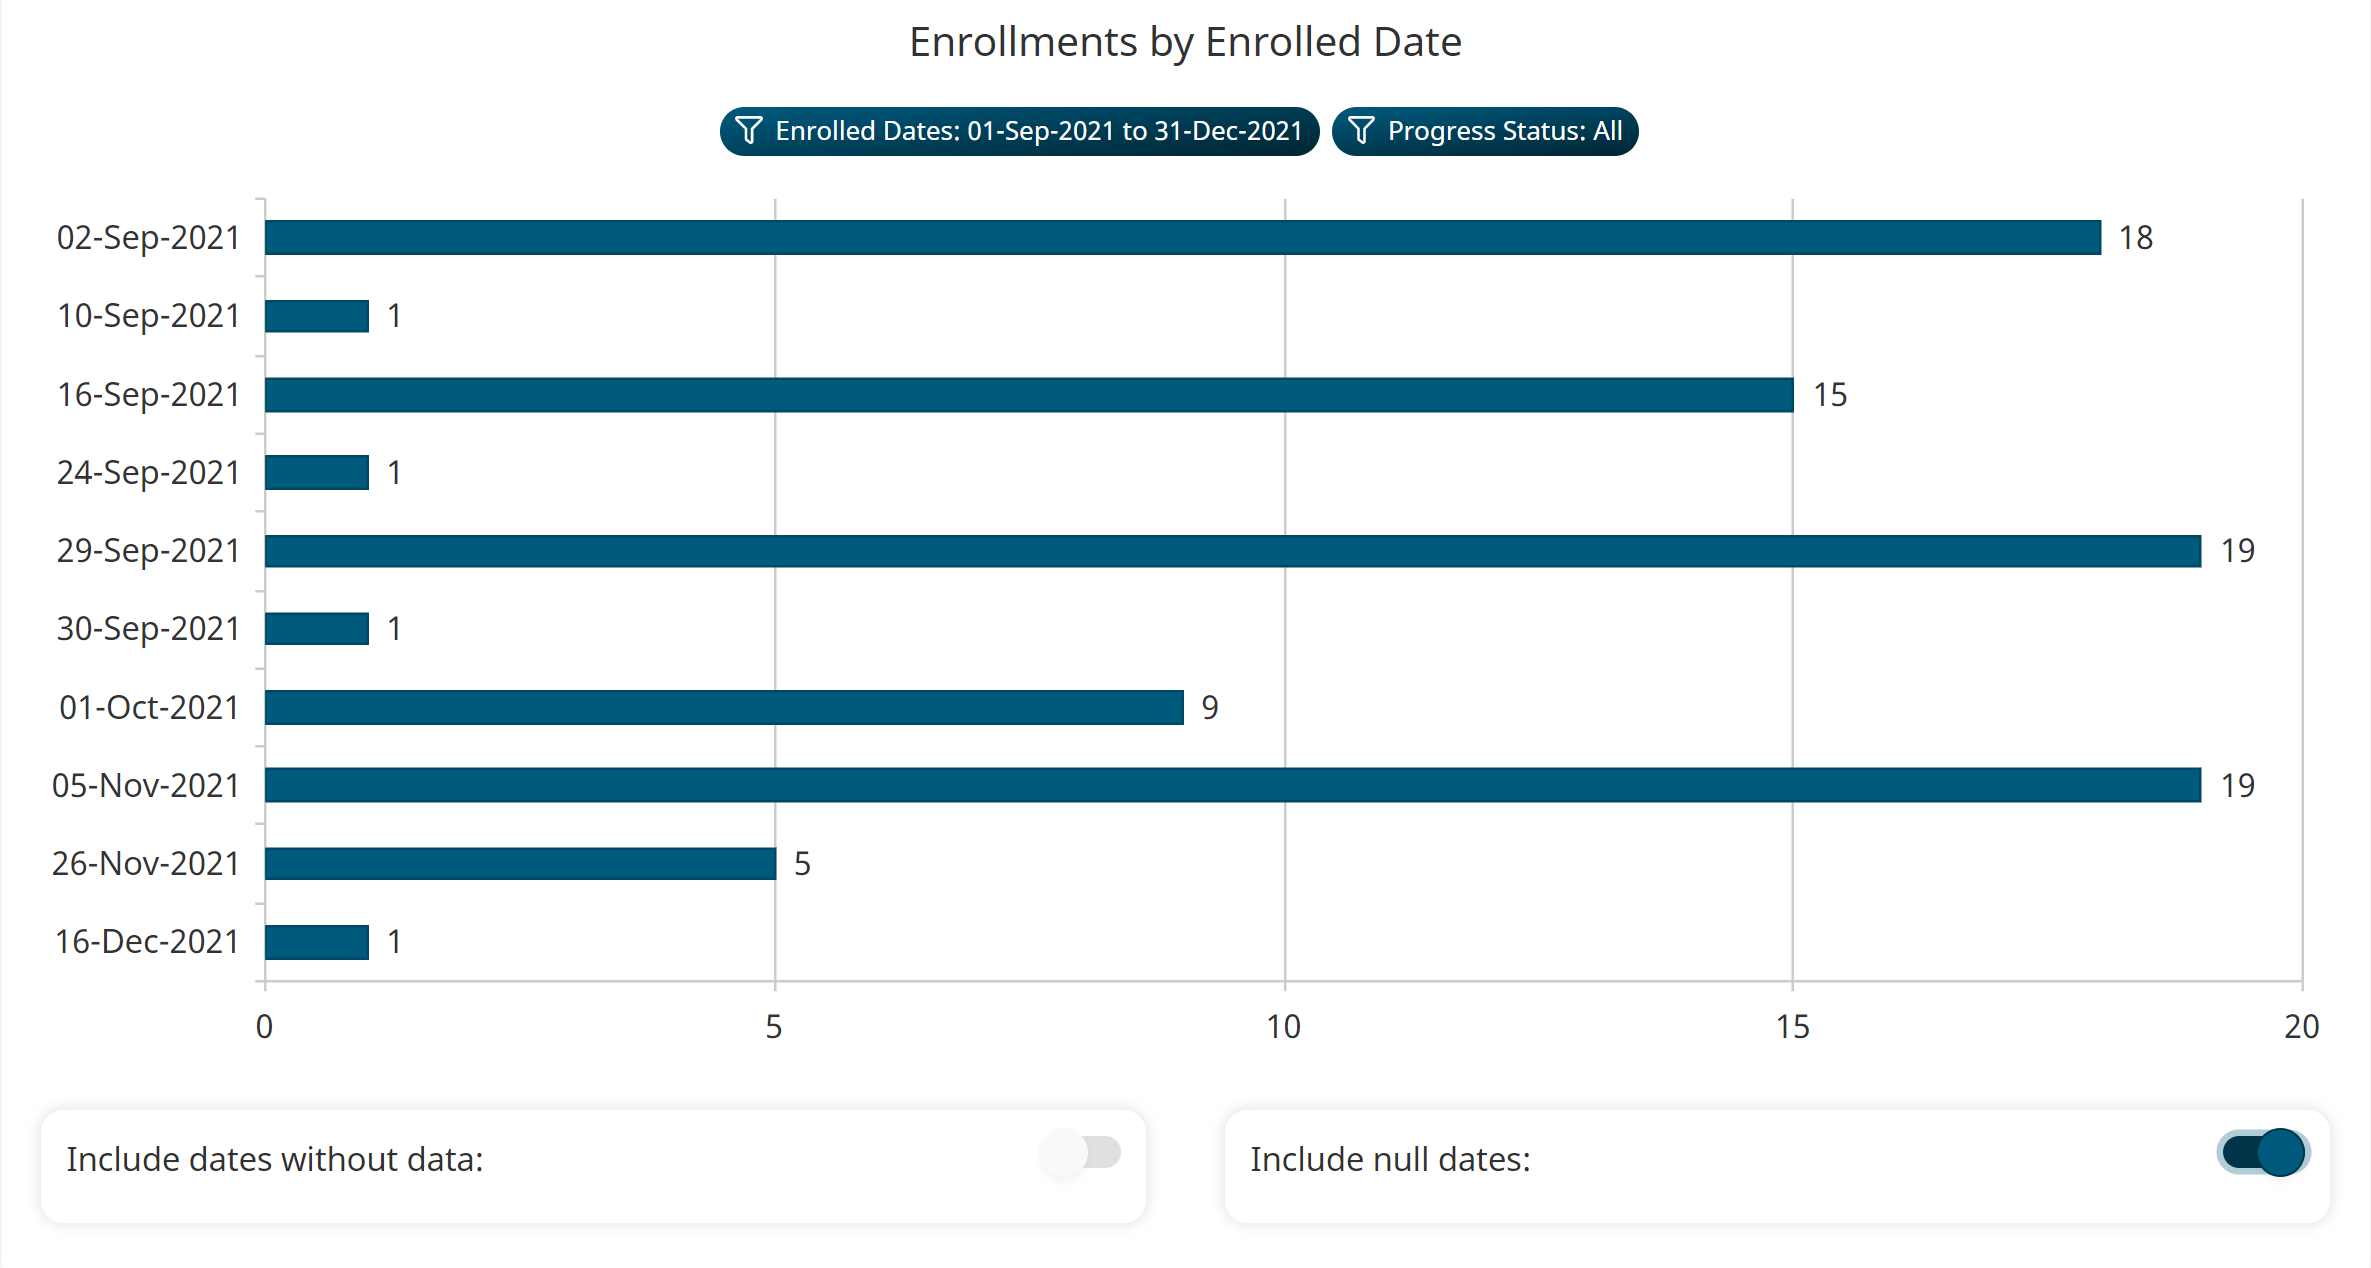
The orientation of the bar chart is automatically determined by SmarterU based on the number of data series. If the chart contains five or fewer data series, the orientation of the bar chart is horizontal.
If the chart contains six or more data series, the orientation of the chart is vertical to make the chart easier to view. If the bar chart has 15 or more data series, the height of the chart will also increase to accommodate all the data series.
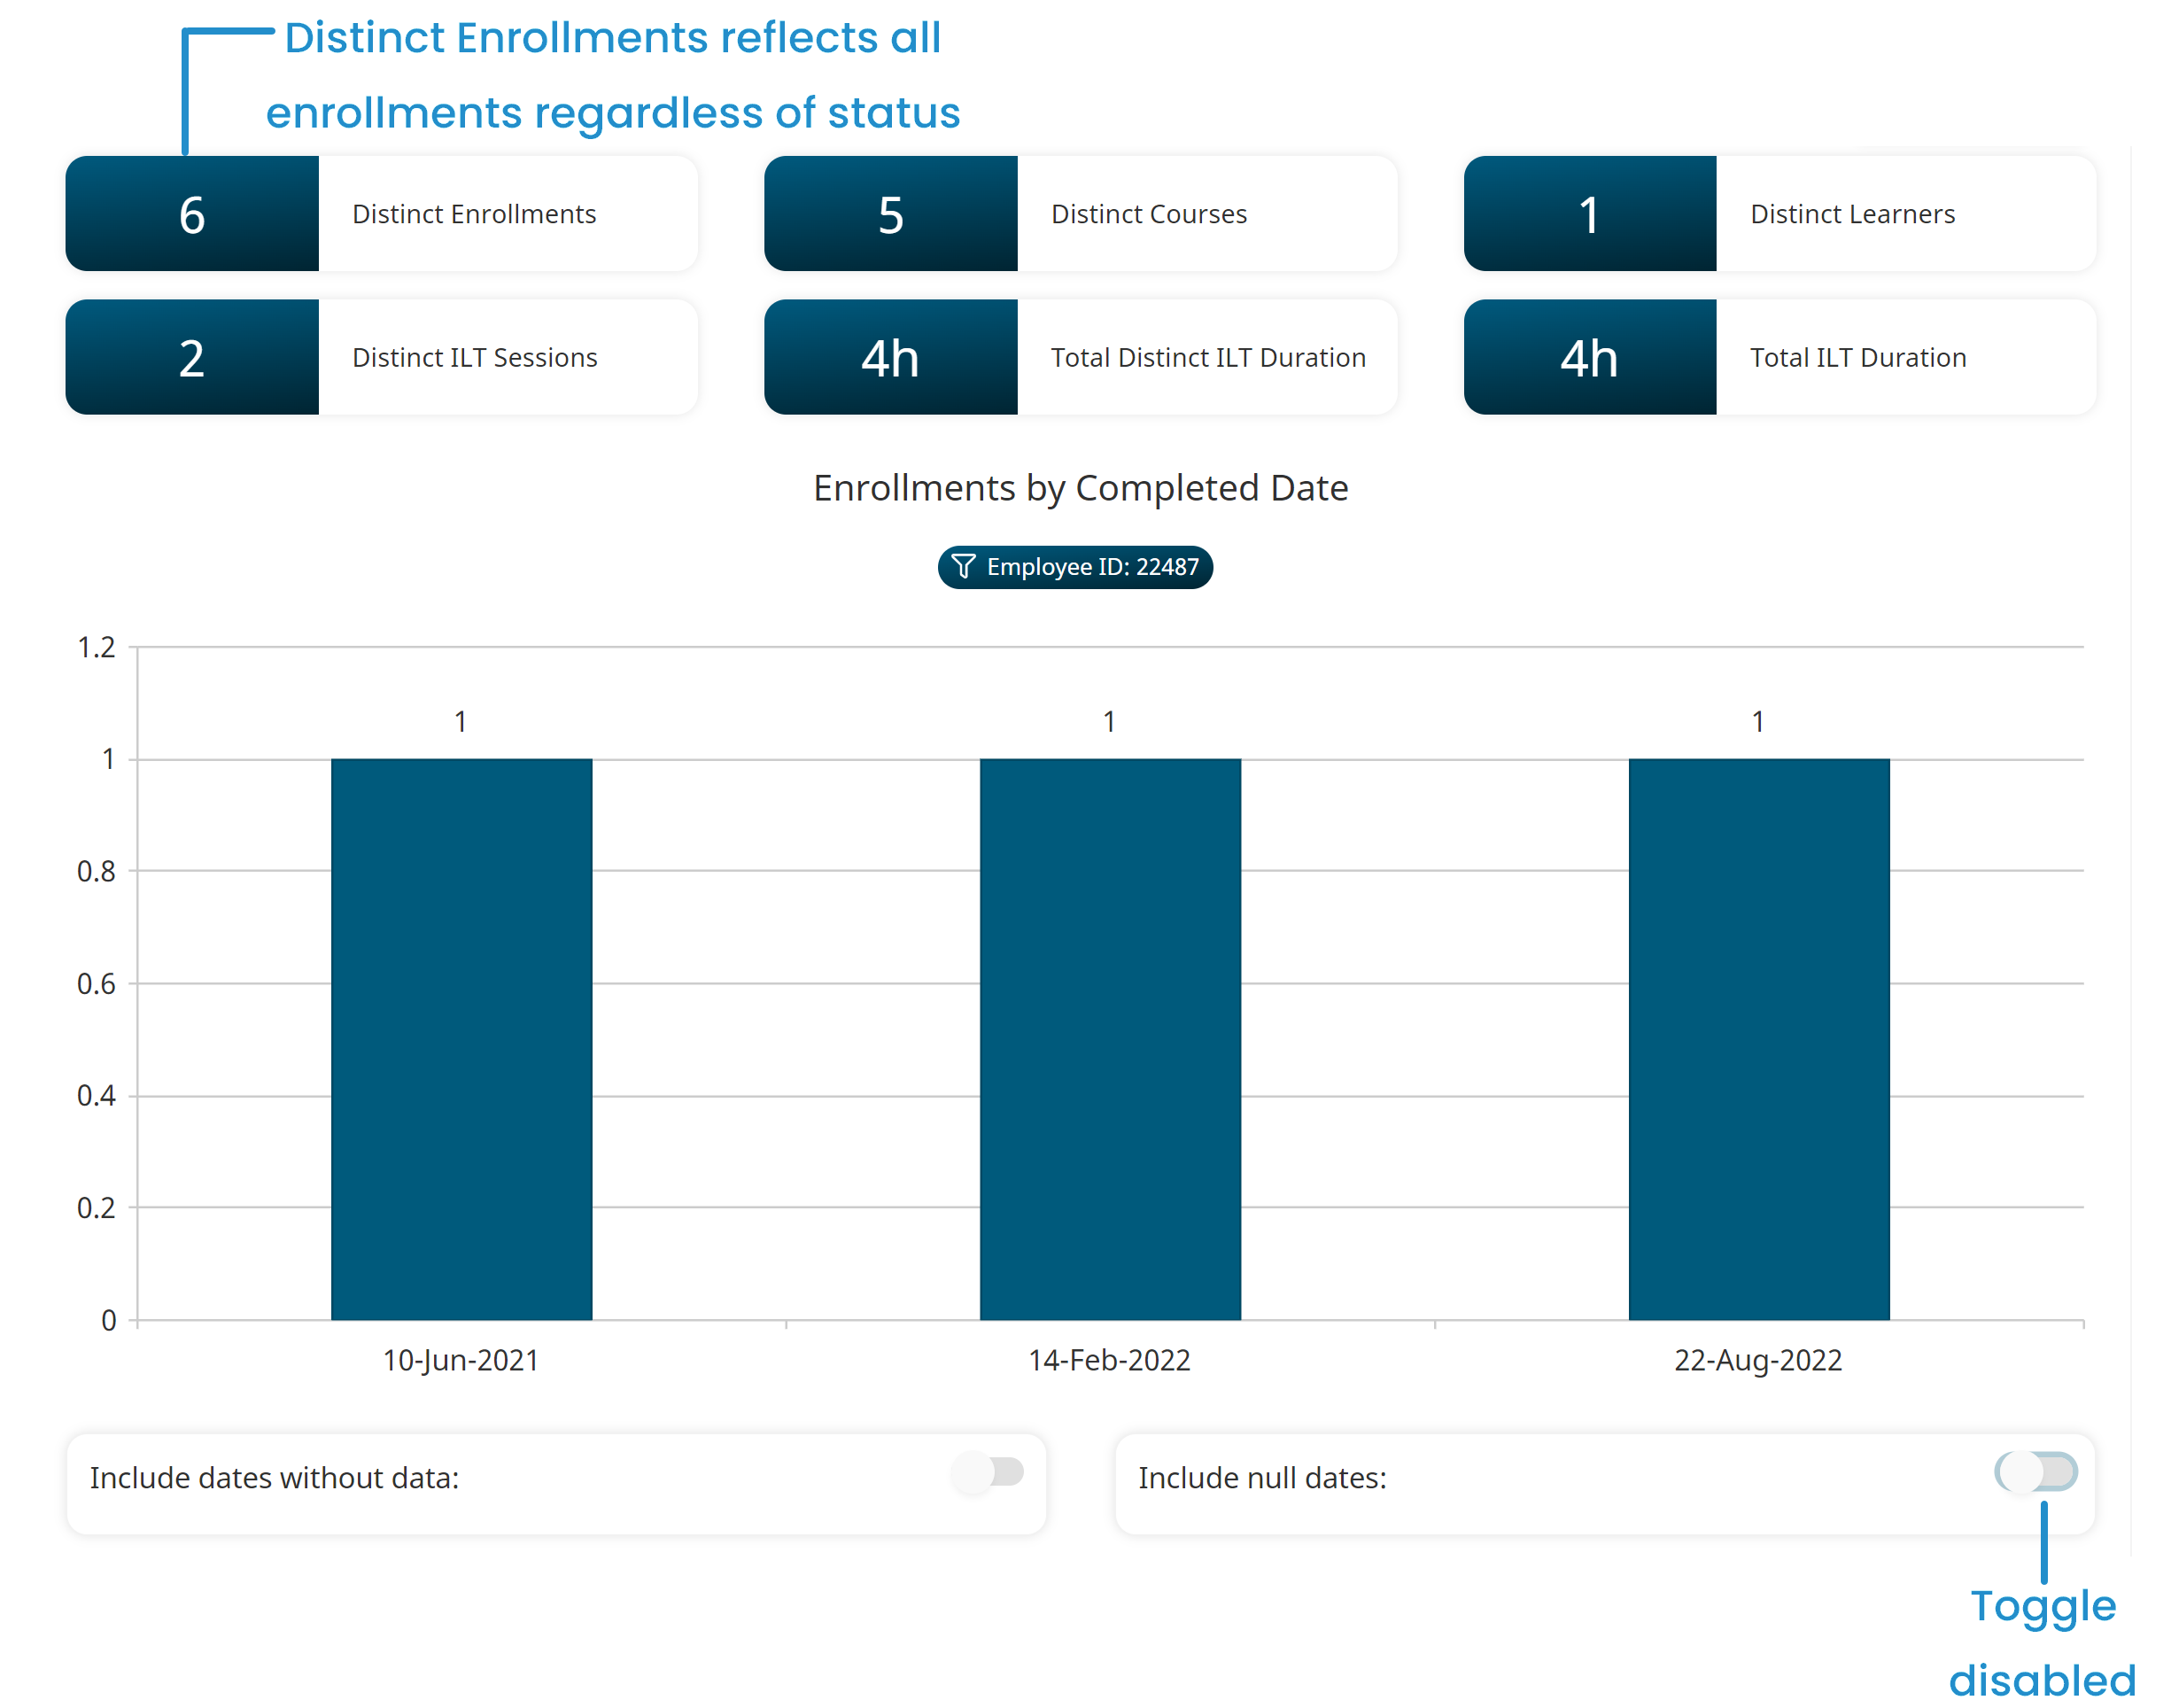
If the report's Allow Edit setting is enabled and the Group Output By column is a date, an Include Dates Without Data toggle and an Include Null Dates toggle display below the chart.
Understanding the Bar Chart's Heading
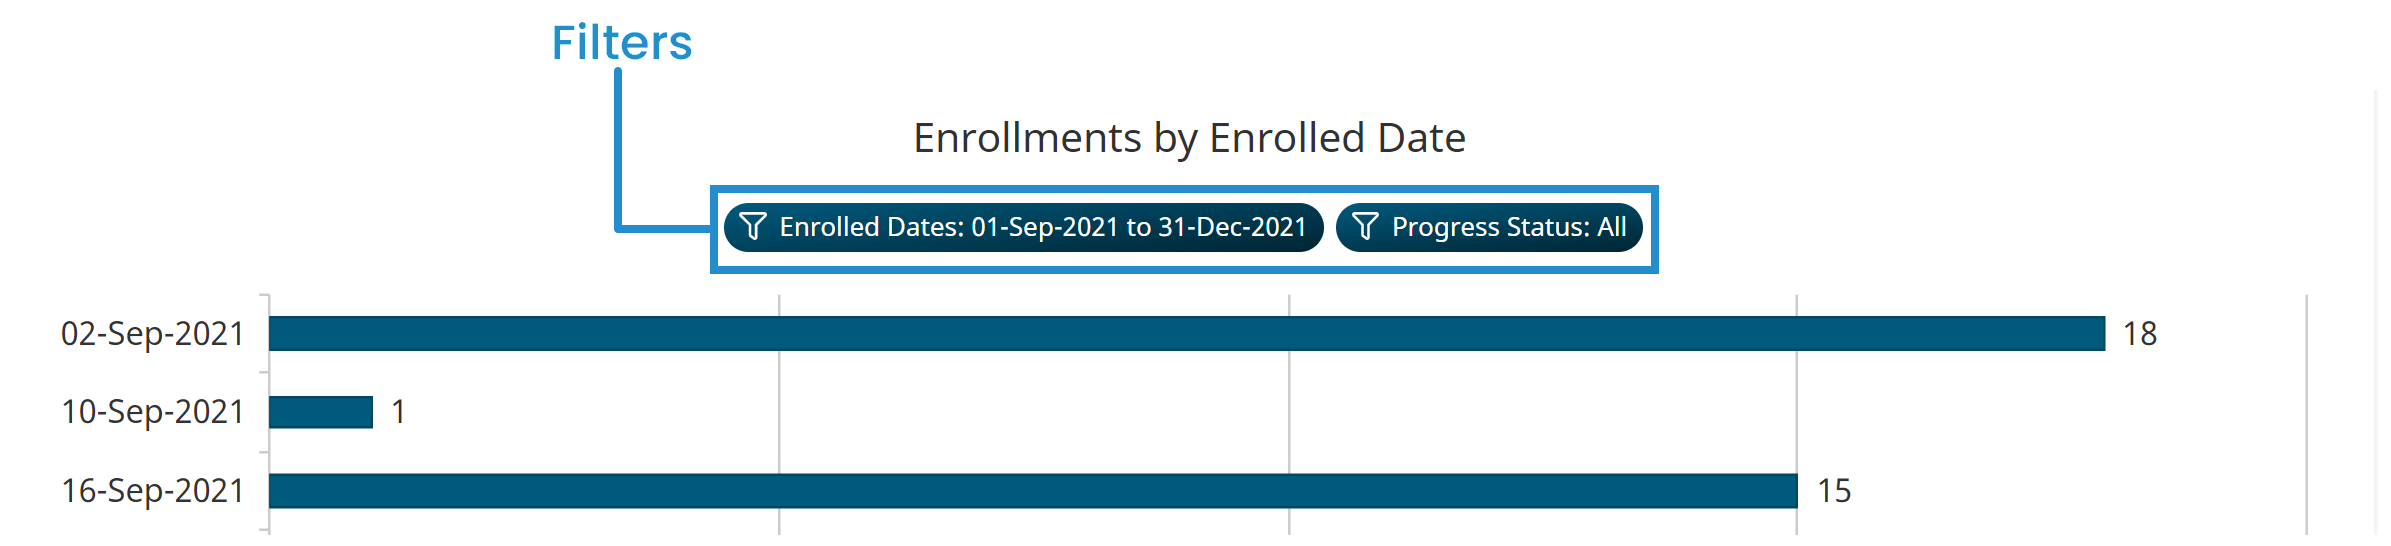
A bar chart's heading consists of the report's title and the report's filters.
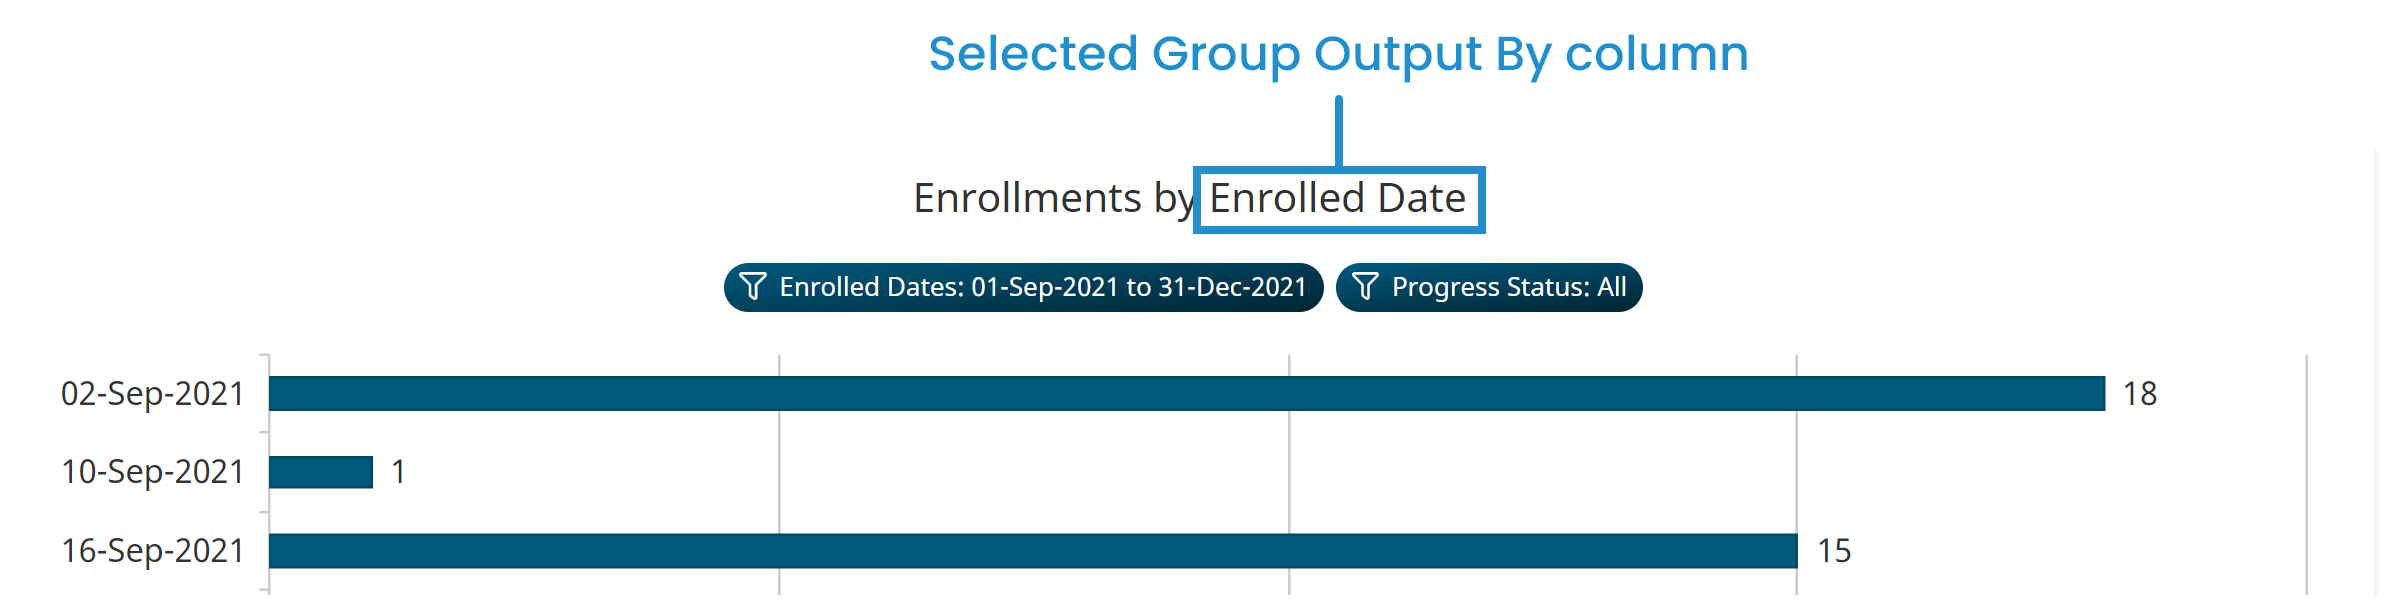
For custom Enrollment Reports, the chart's title will be in the format Enrollments by <GroupByColumn> where <GroupByColumn> is the column that you selected from the report's Group Output By setting.
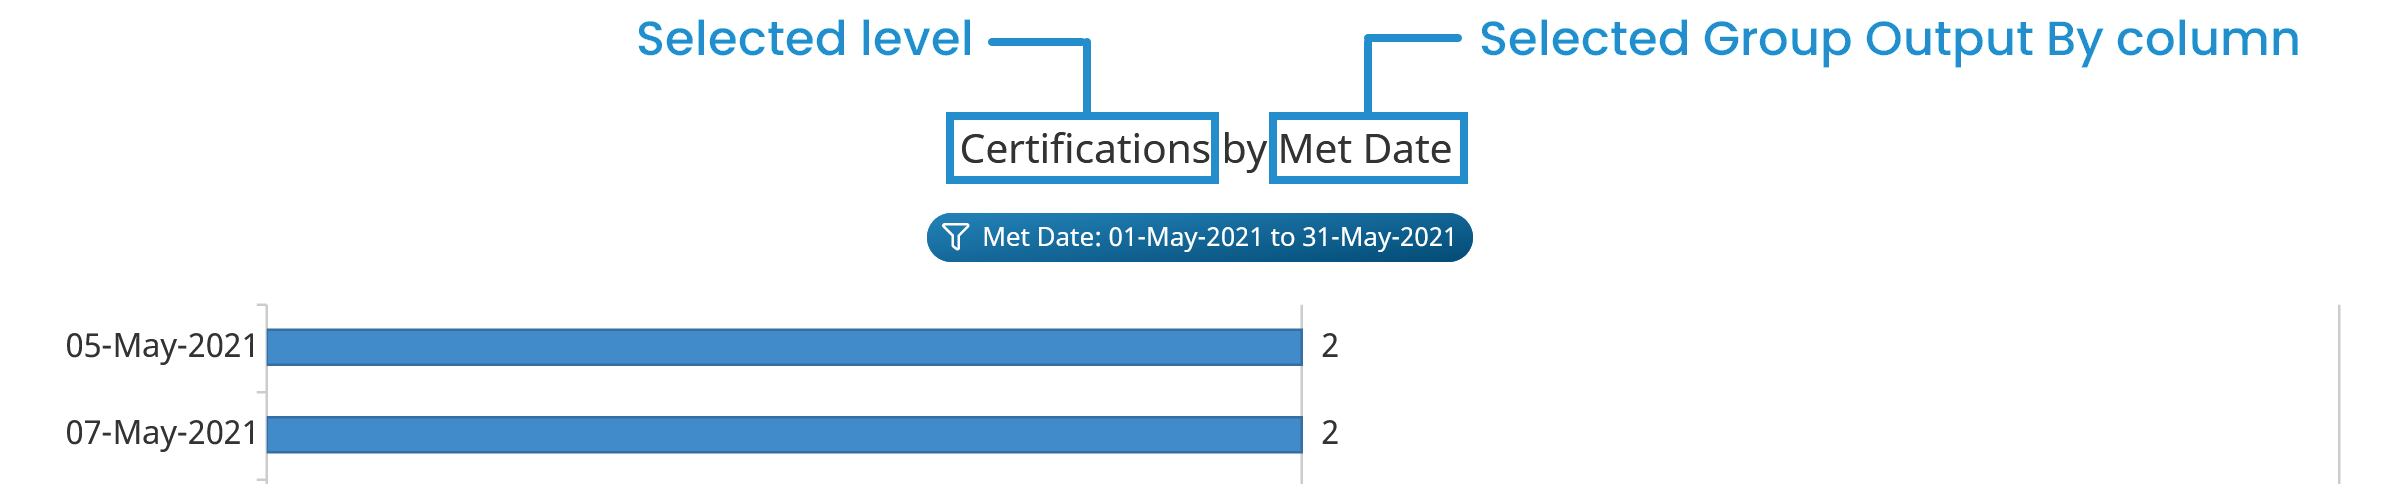
For custom Learning Plan Reports, the chart's title will be in the format <Level> by <GroupByColumn> where:
- <Level> is the Level selected from the report's Type accordion
- <GroupByColumn> is the column selected from the report's Group Output By setting
Any filters specified for the custom Enrollment or Learning Plan Report display below the chart title.
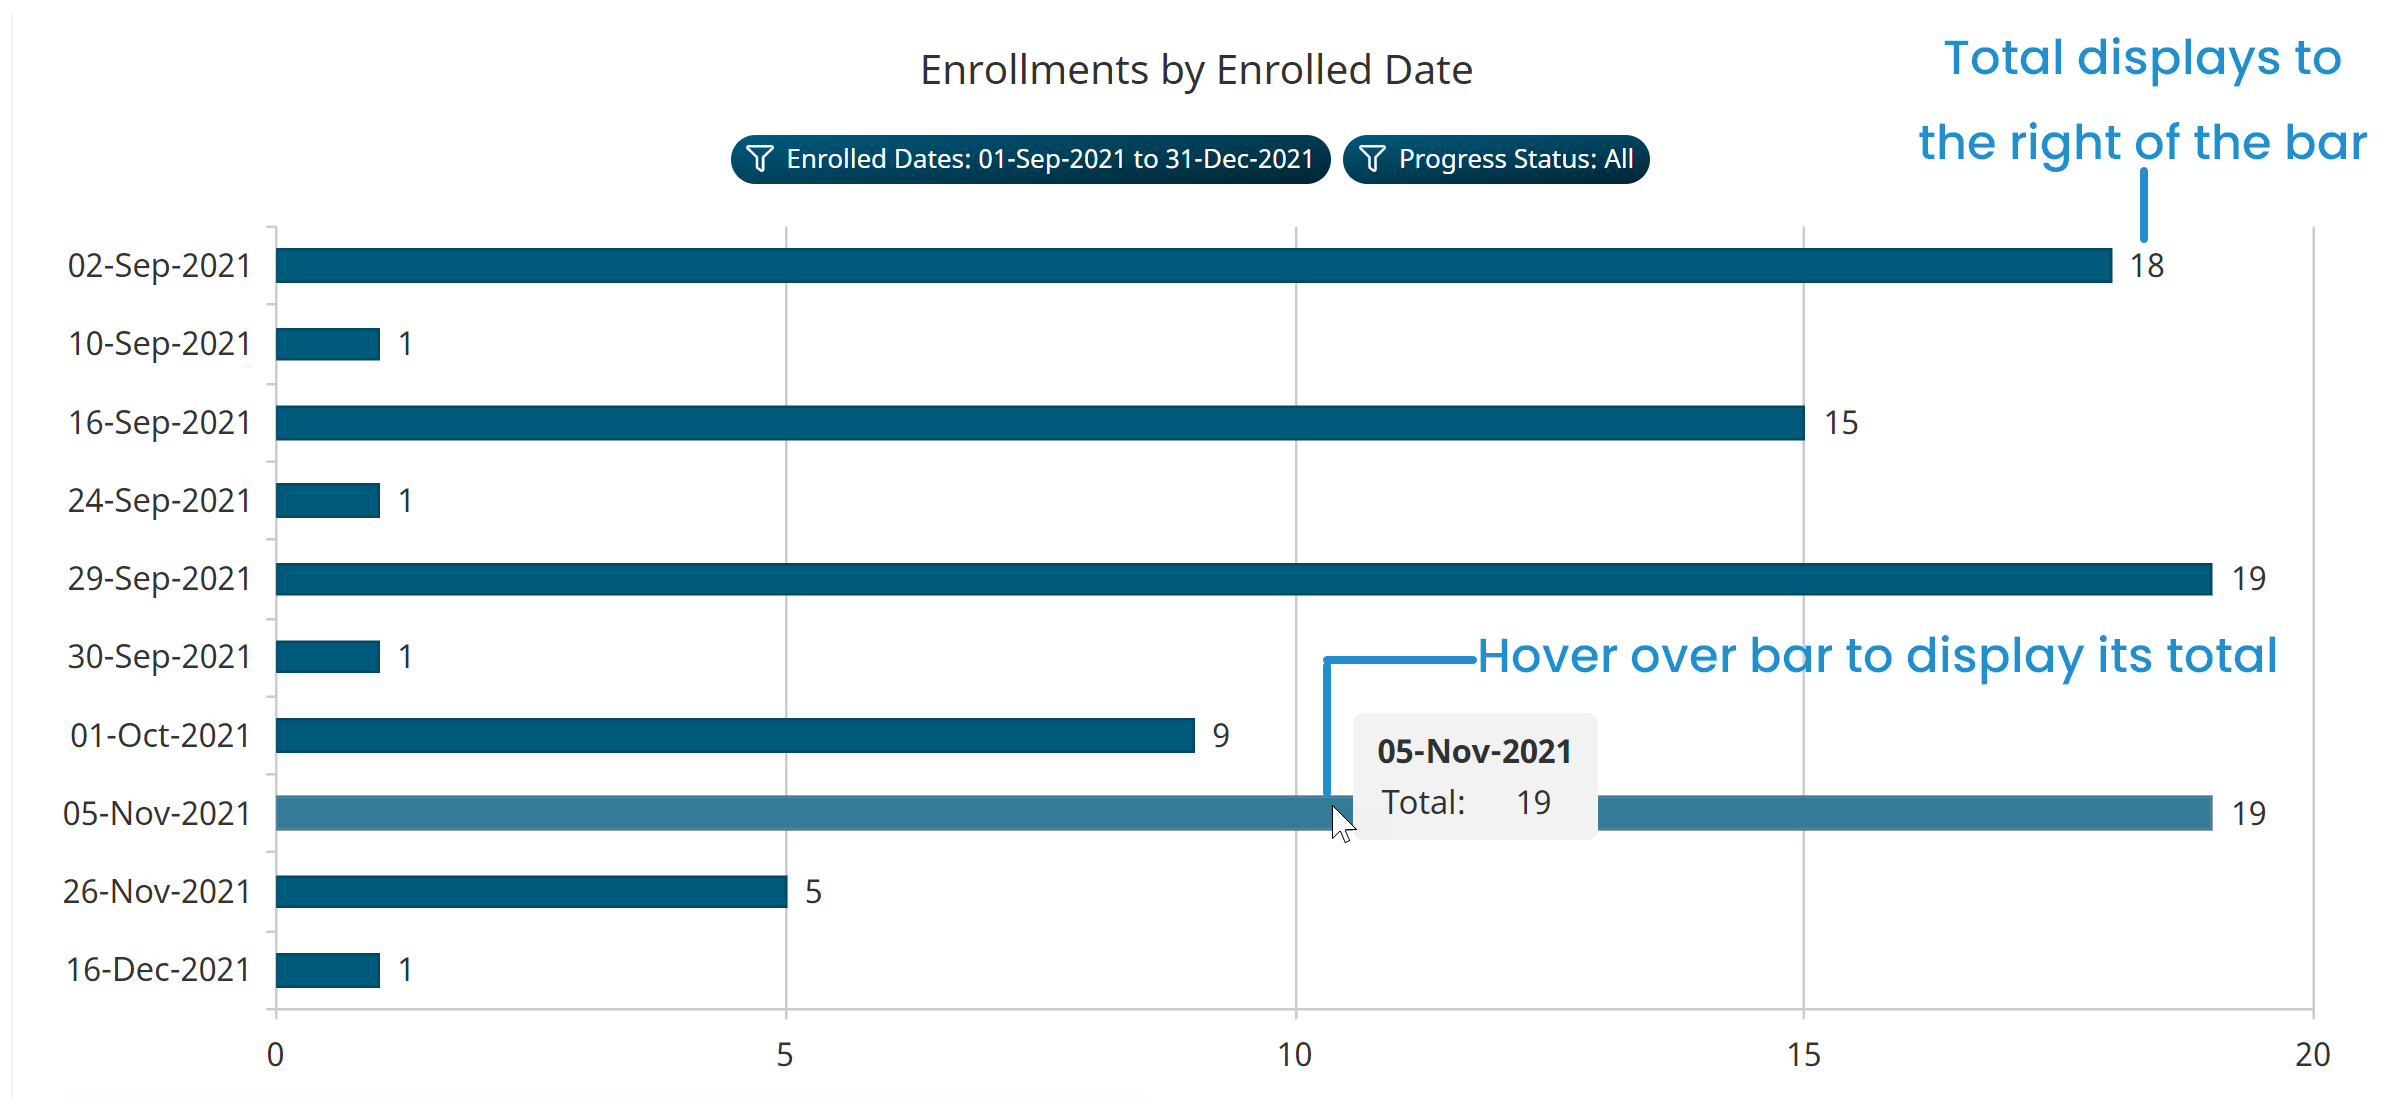
Viewing a Bar's Total
A bar's total displays at the end of the bar. You can also hover over a bar to view its total.
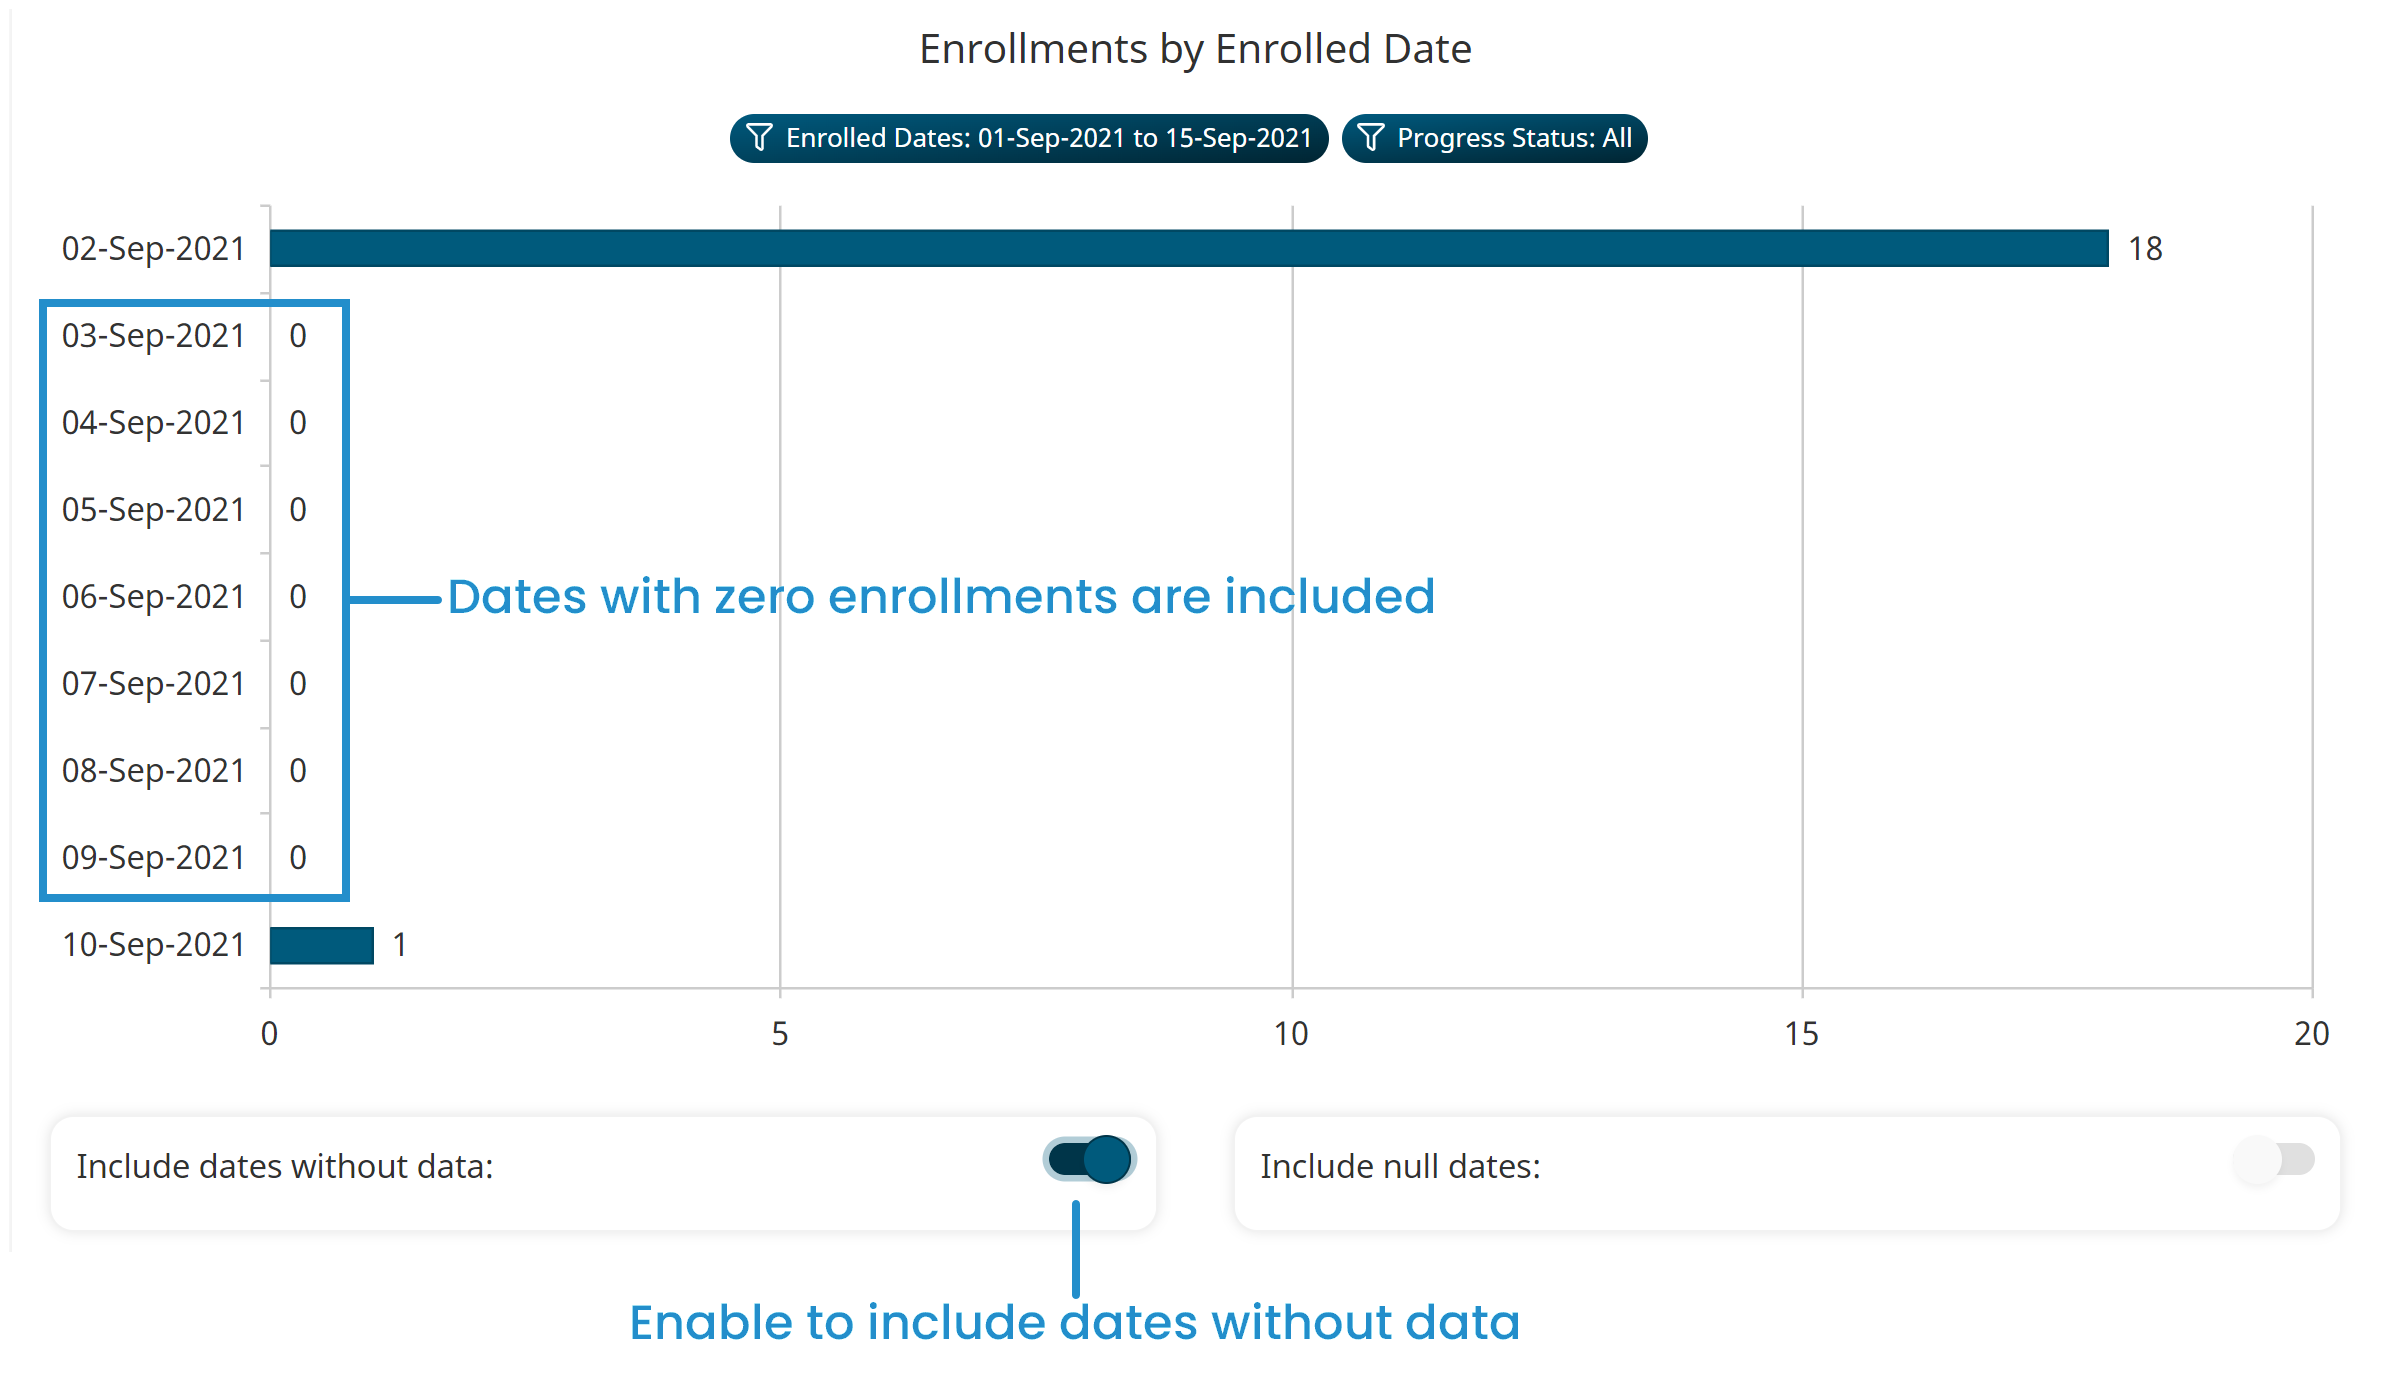
Including Dates Without Data
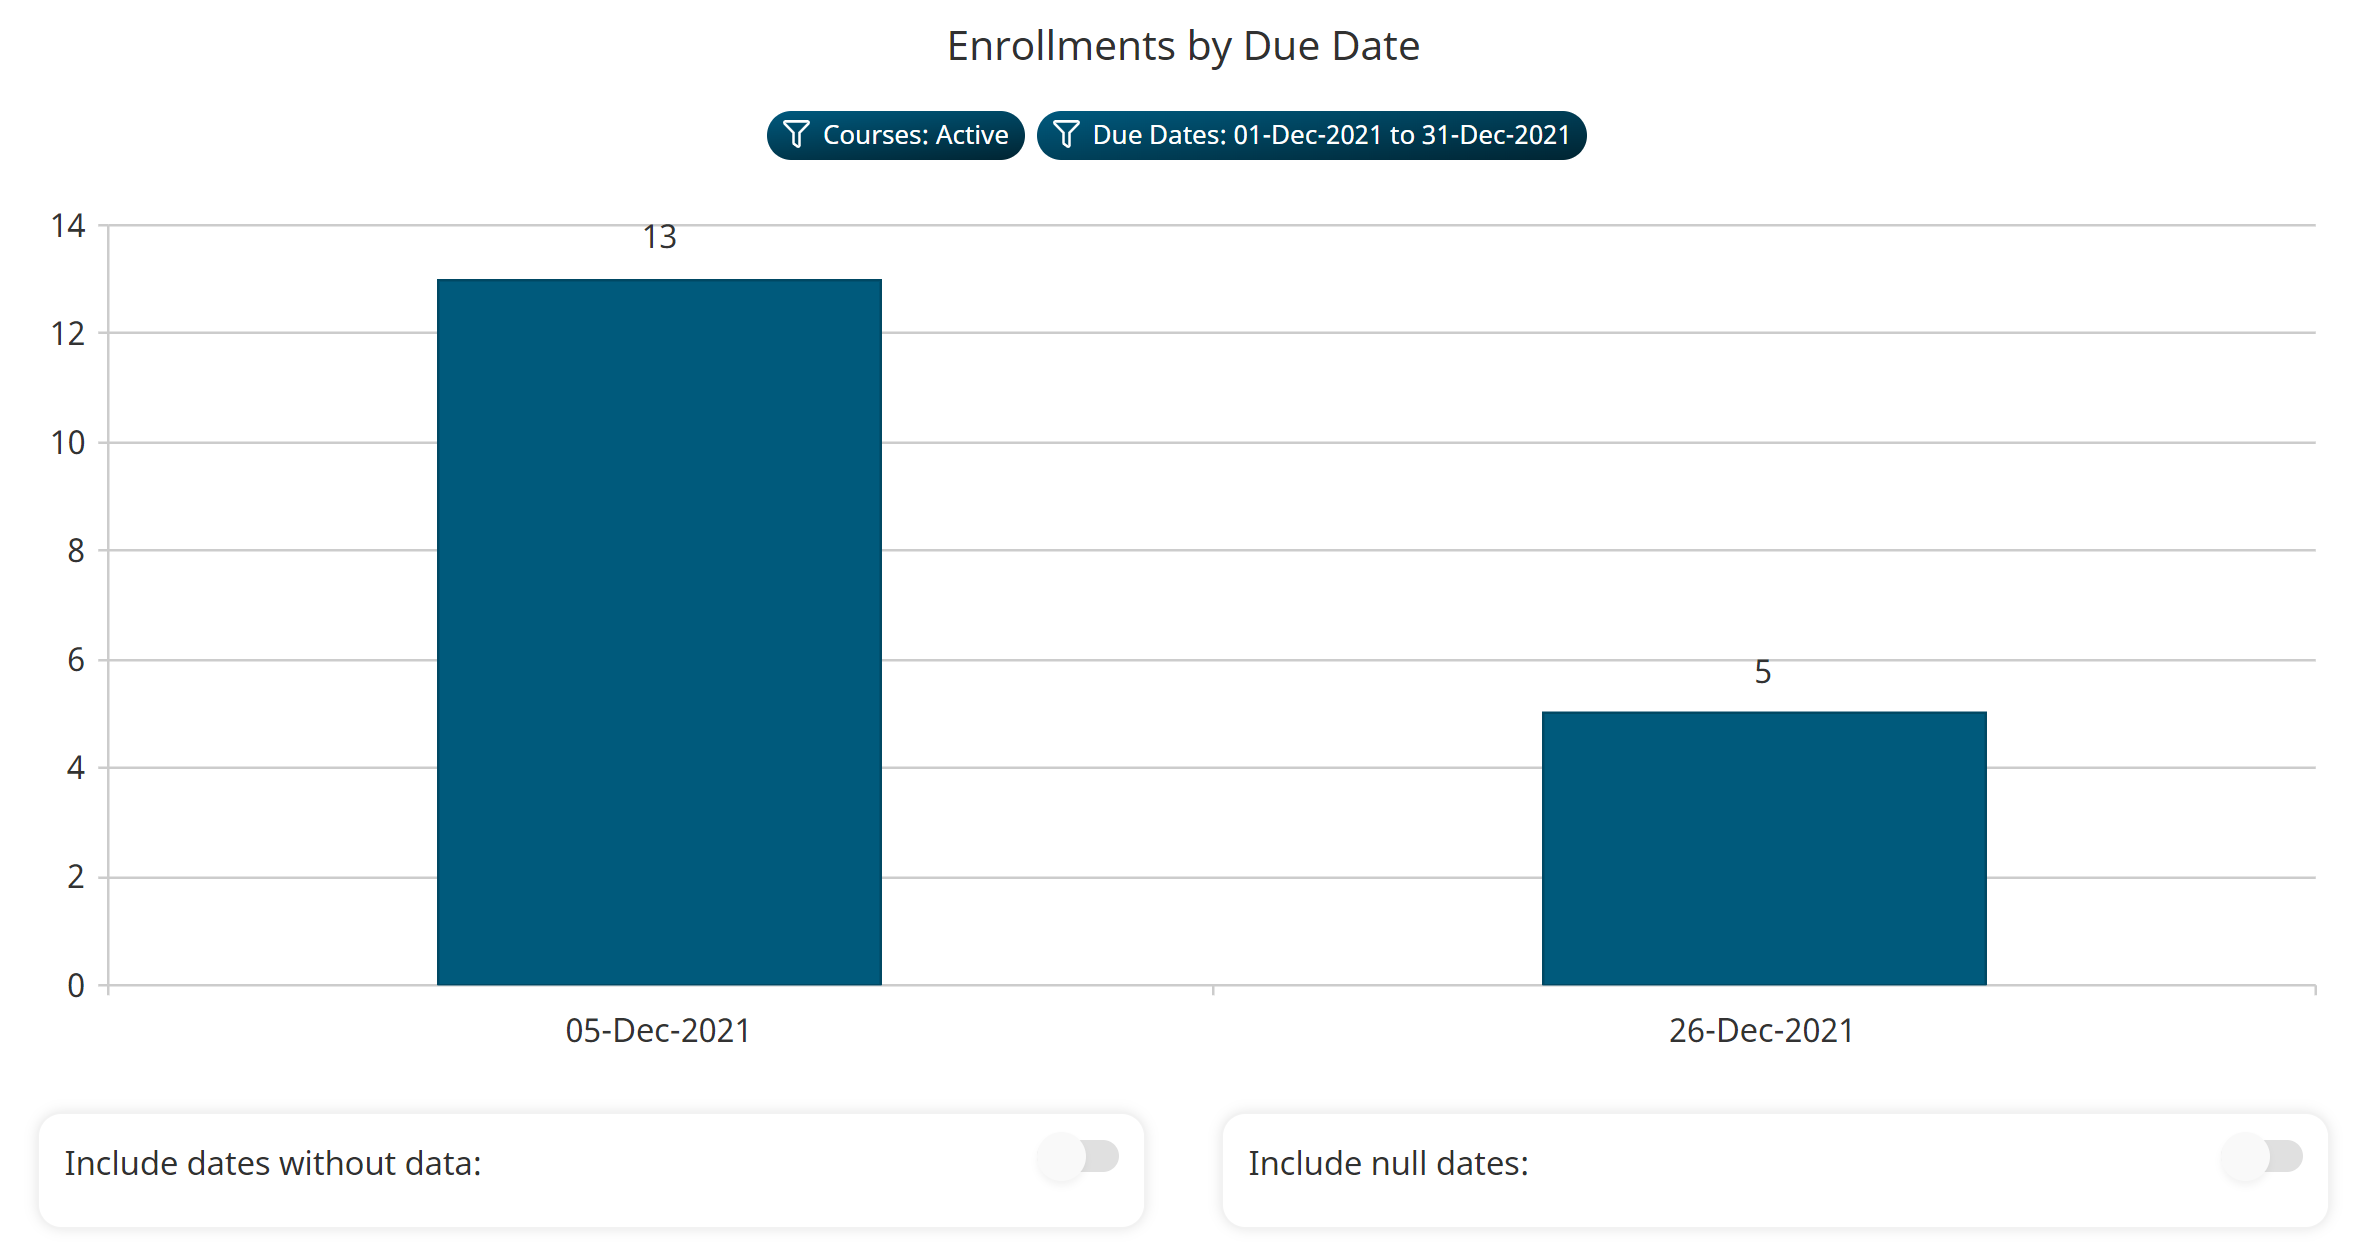
If the report's Allow Edit setting is enabled and the Group Output By column is a date, the Include Dates Without Data toggle displays below the bar chart. This toggle enables you to control whether dates without data are included in the chart. For example, suppose your Enrollment Report reports on enrollments by due date. Enabling Include Dates Without Data includes all dates in the chart regardless of whether course enrollments are due.
 In this example, when Include Dates Without Data is disabled, only those dates that have a course enrollment due are displayed in the chart.
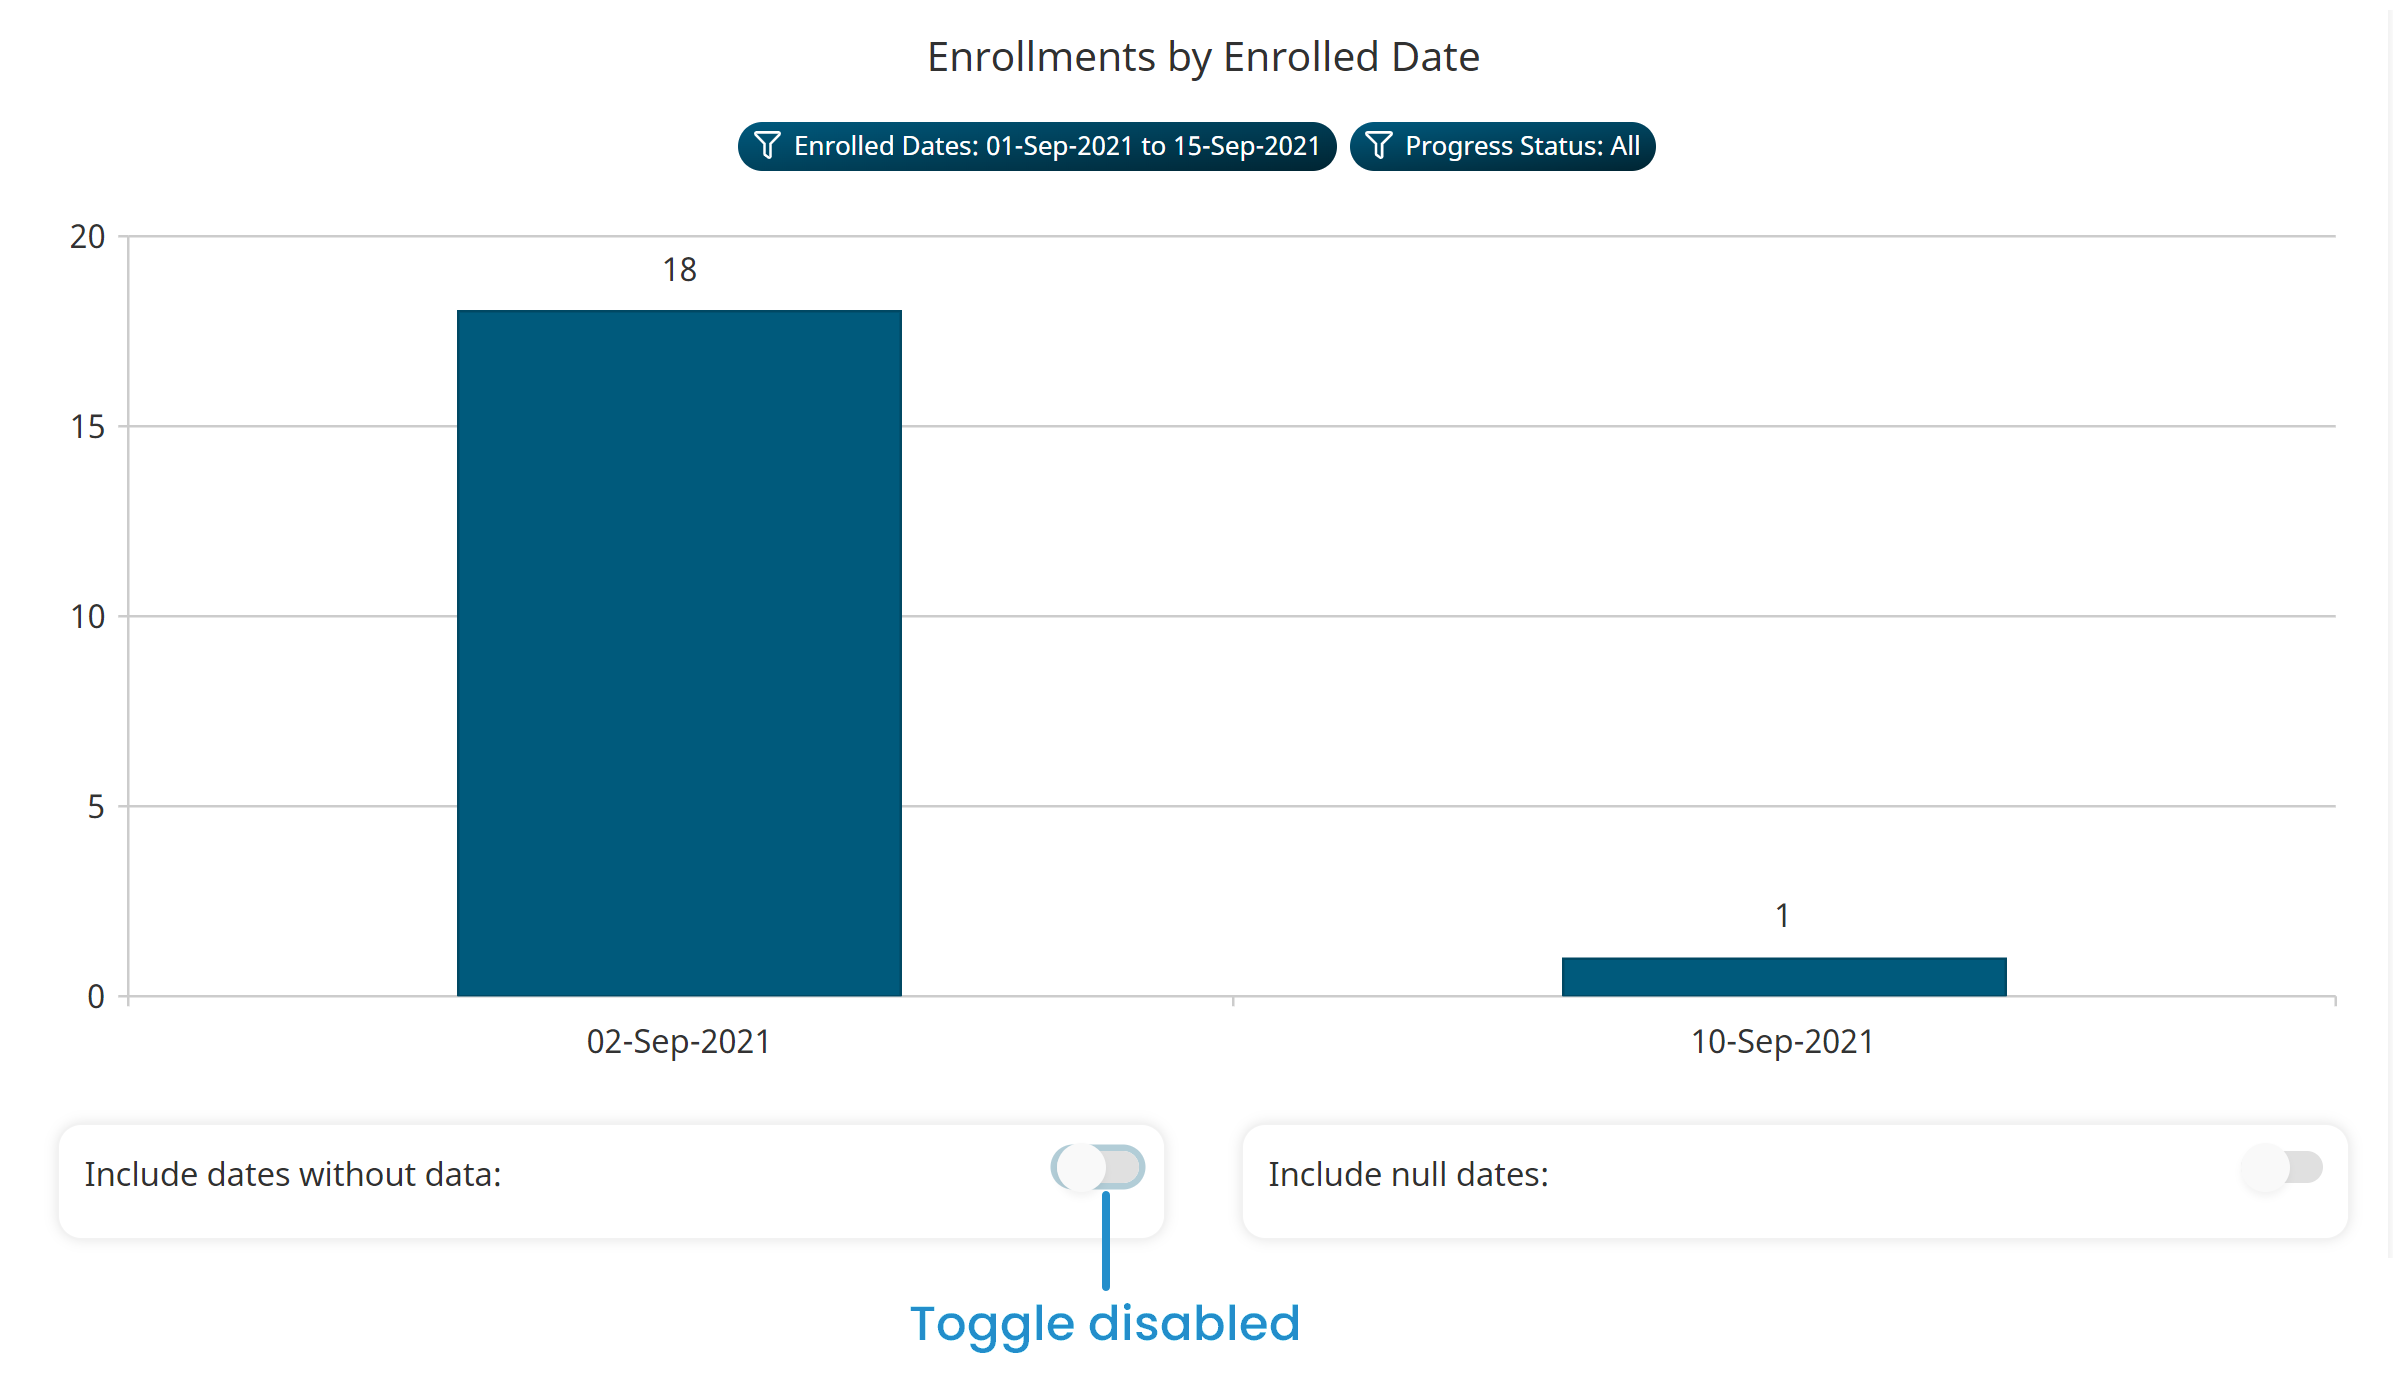
In this particular example, the orientation also changes to horizontal since there are only two data series in the chart.
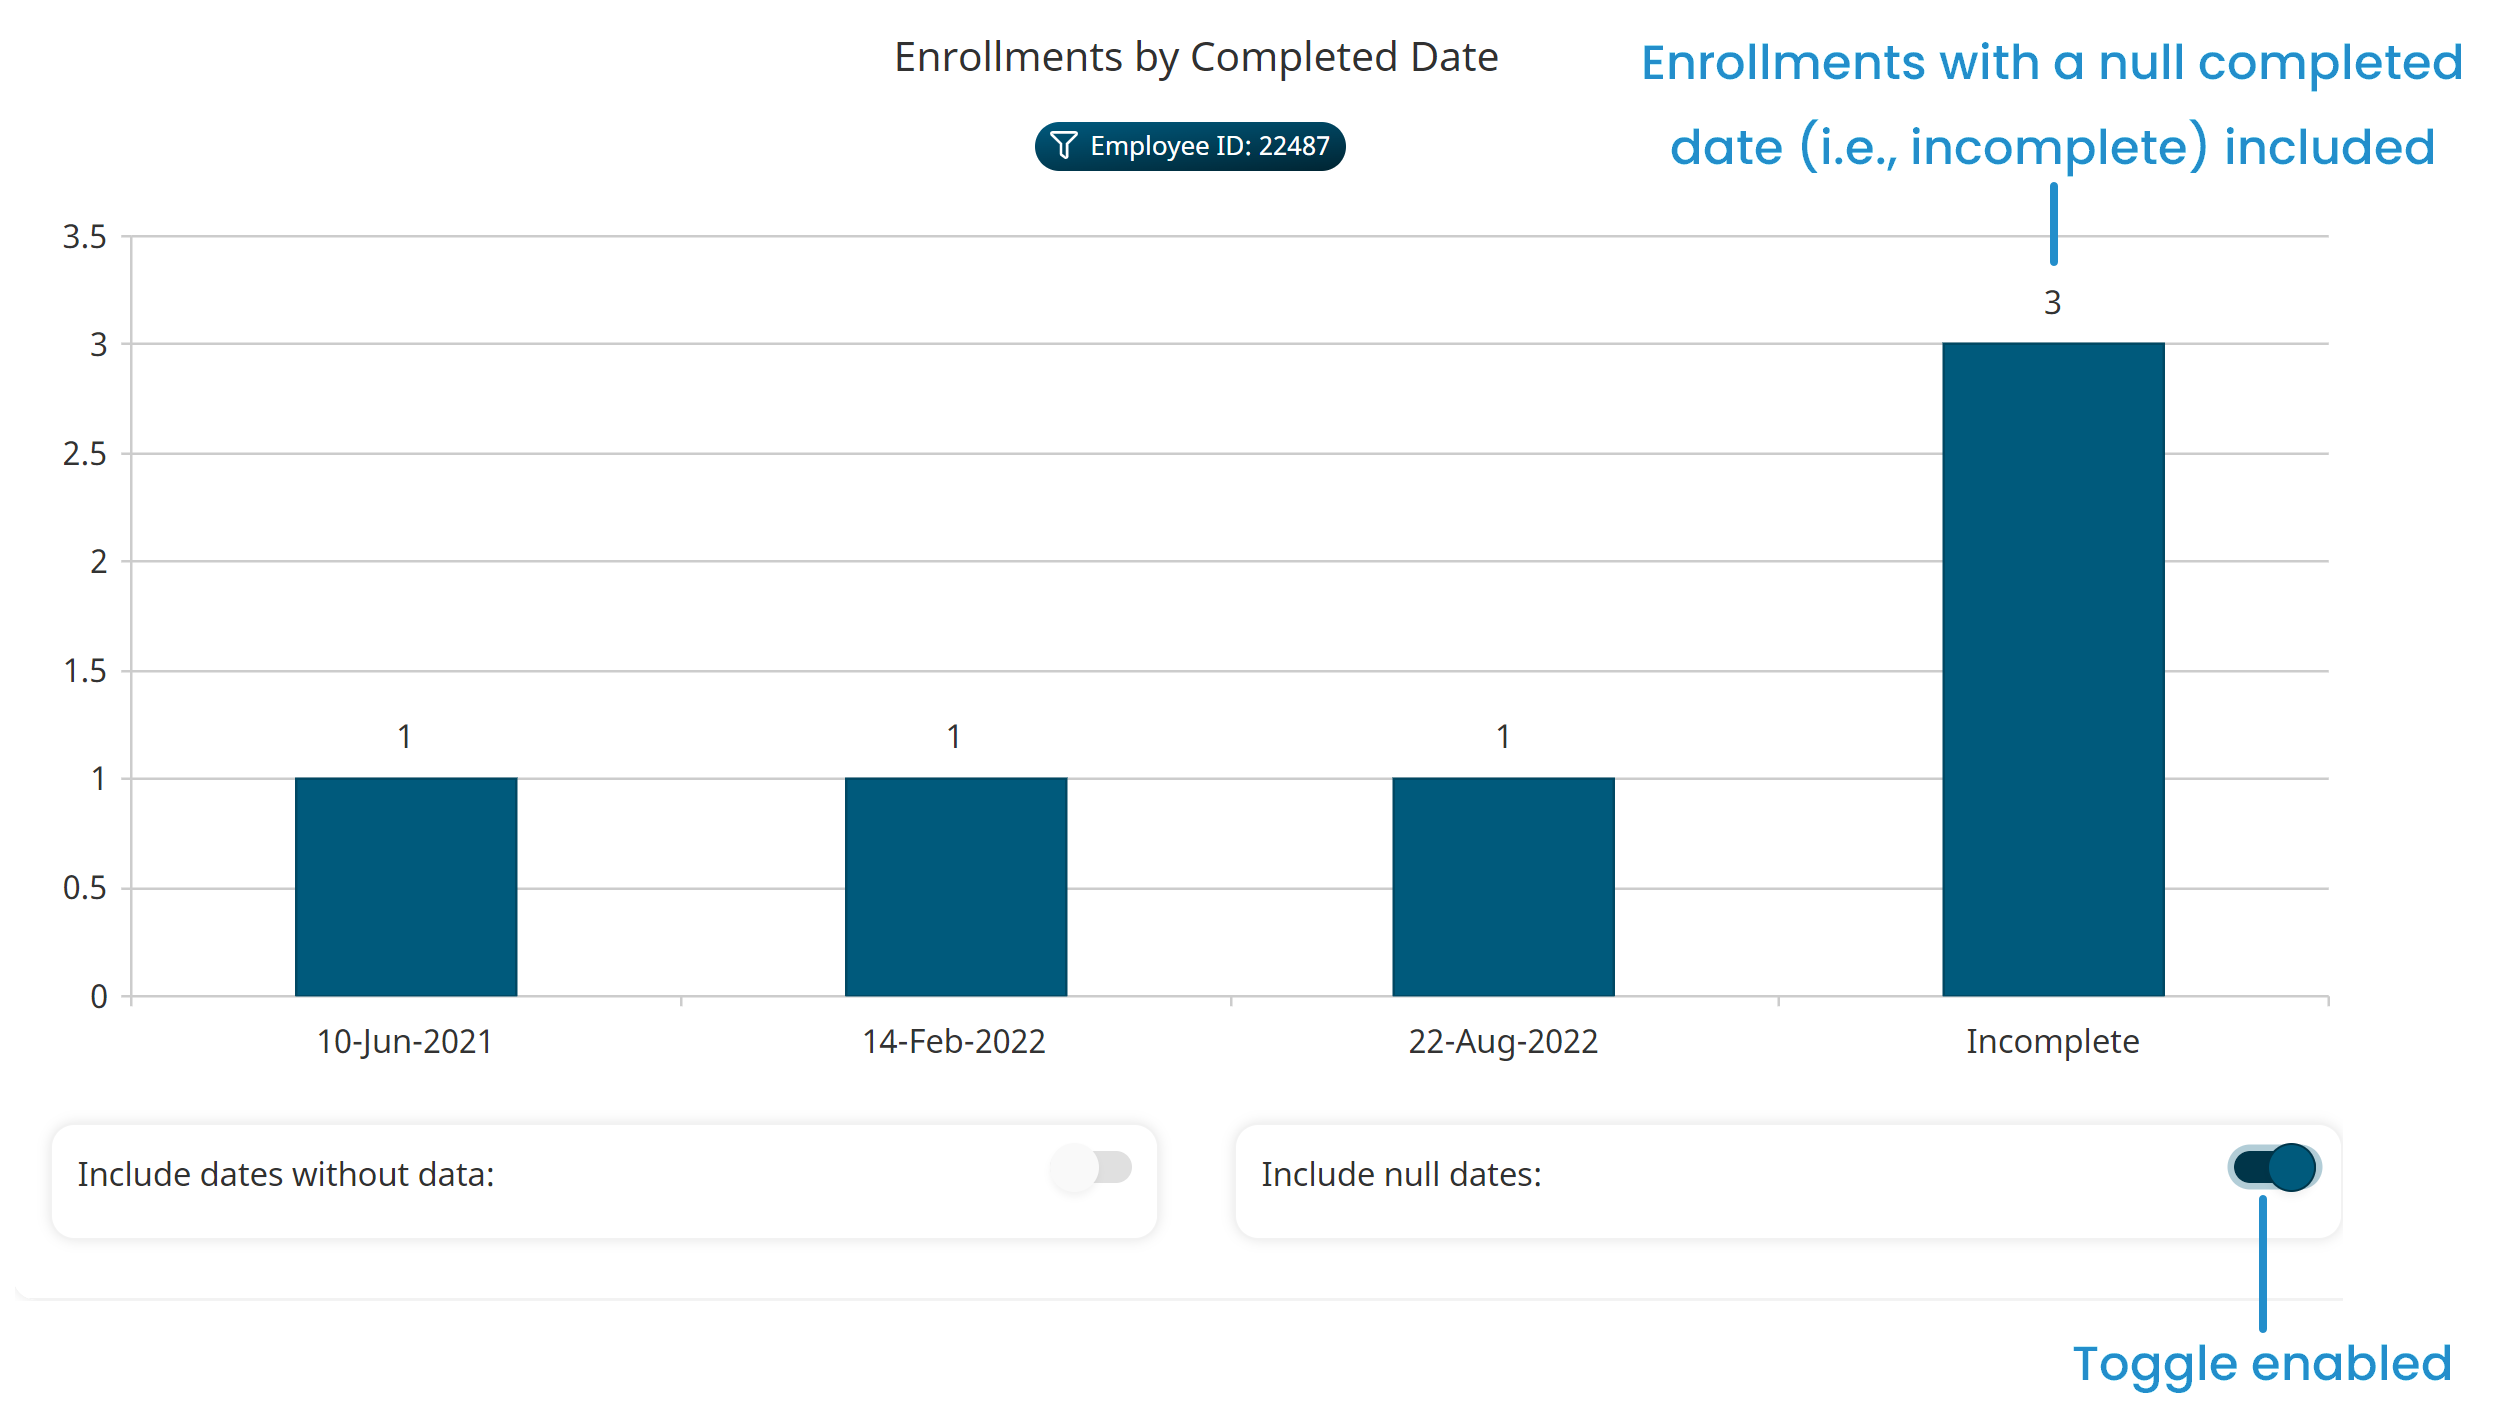
Including Null Dates
If the report's Allow Edit setting is enabled and the Group Output By column is a date, the Include Null Dates toggle displays below the bar chart. This toggle enables you to control whether null dates are included in the chart. For example, suppose your Enrollment Report reports on enrollments by completion date. Enabling Include Null Dates includes enrollments that have a null completion date (i.e., enrollments with an Incomplete status) in the report.
 When Include Null Dates is disabled, these incomplete enrollments are not displayed in the chart.