A custom learning plan report's output options enable you to specify the type of output (i.e., grid, chart, or both) the Learning Plan Report produces.
Output options are specified in the Output accordion of the Add/Edit Learning Plan Report workscreen.
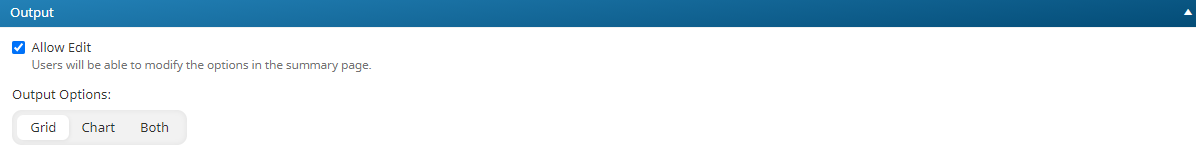
Settings
Allow Edit
If checked, users who run the report will be able to change the report's output options.
Output Options
Select one of the following:
- Grid - Displays the report's output in a tabular format.
- Chart - Displays the report's output in a graphical format of the selected chart type.
- Both - Displays the report's output in a tabular and graphical format.
Chart Type
This setting is only available when the Output Options setting is set to Chart or Both.
- Donut
- Bar - This option is only available when the report's Type setting is set to Detailed List.
- Stacked
Group Output By
This setting is only available when the Output Option setting is set to Chart or Both. The selected column controls how the data is grouped on the chart.
The available group by columns will depend on the report's Level setting and chart type. Refer to the level for details:
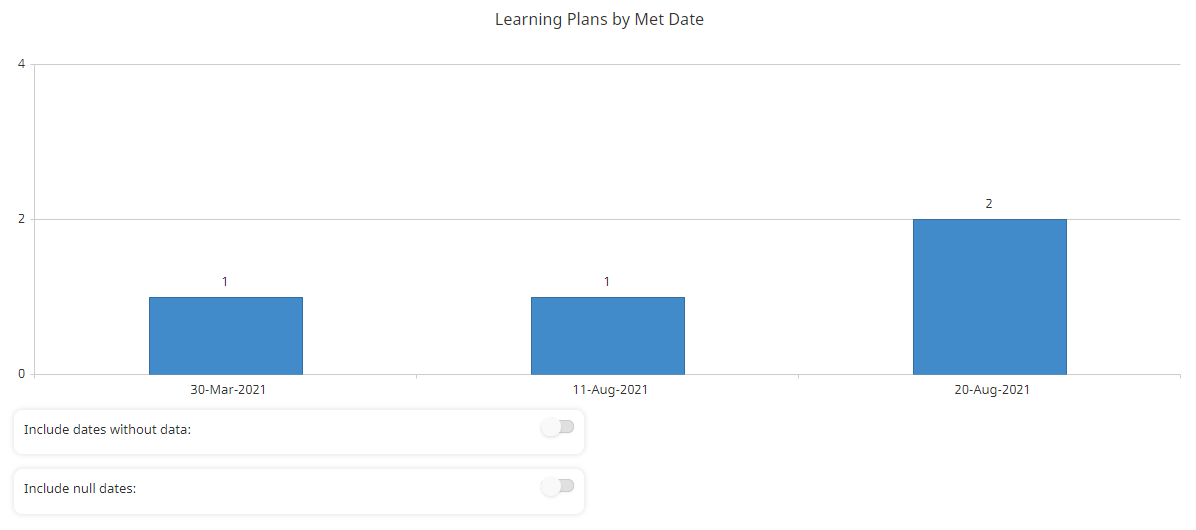
Include Dates Without Data by Default
This setting is only available when the Chart Type setting is set to Bar, and the selected Group Output By setting selected is a date. If enabled, dates that do not have data are included in the chart by default.
For example, suppose your report is reporting on learning plans by met date. If this setting is selected, the output includes all dates regardless of whether any users completed a learning plan on that date. As you can imagine, this would generate a large amount of output since every date is included. A portion of the output is shown below.

However, if the Include Dates Without Data setting is disabled, only dates on which a user completed a learning plan would be included.
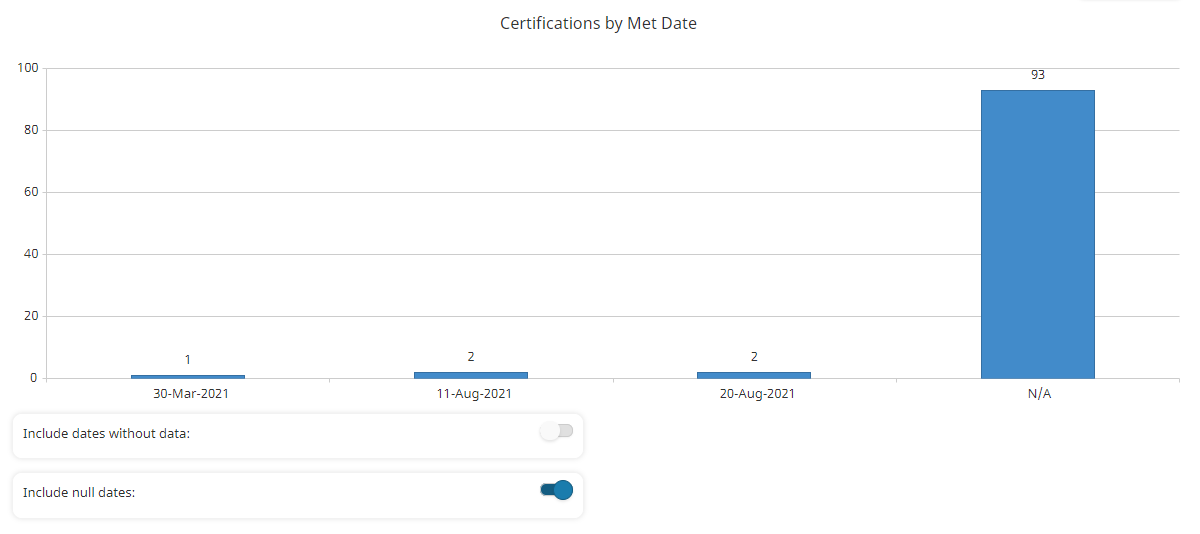
Include Null Dates by Default
This setting is only available when the Chart Type setting is set to Bar, and the selected Group Output By column is a date. If enabled, enrollments that have a null value for the selected Group Output By column are included in the chart by default. A null value is where a column has no value.
For example, suppose your Learning Plan Report reports on certifications by met date. If this setting is enabled, certifications that have no completion date (i.e., certifications with an Not Met status) are included in the report.
Learning Plan Group By Columns
Chart Type | Available Group By Columns |
|---|---|
| |
| |
|
Certification Group By Columns
Chart Type | Available Group By Columns |
|---|---|
| |
| |
|
Requirement Group By Columns
Chart Type | Available Group By Columns |
|---|---|
| |
| |
|
Action and Course Group By Columns
Chart Type | Available Group By Columns |
|---|---|
| |
| |
|