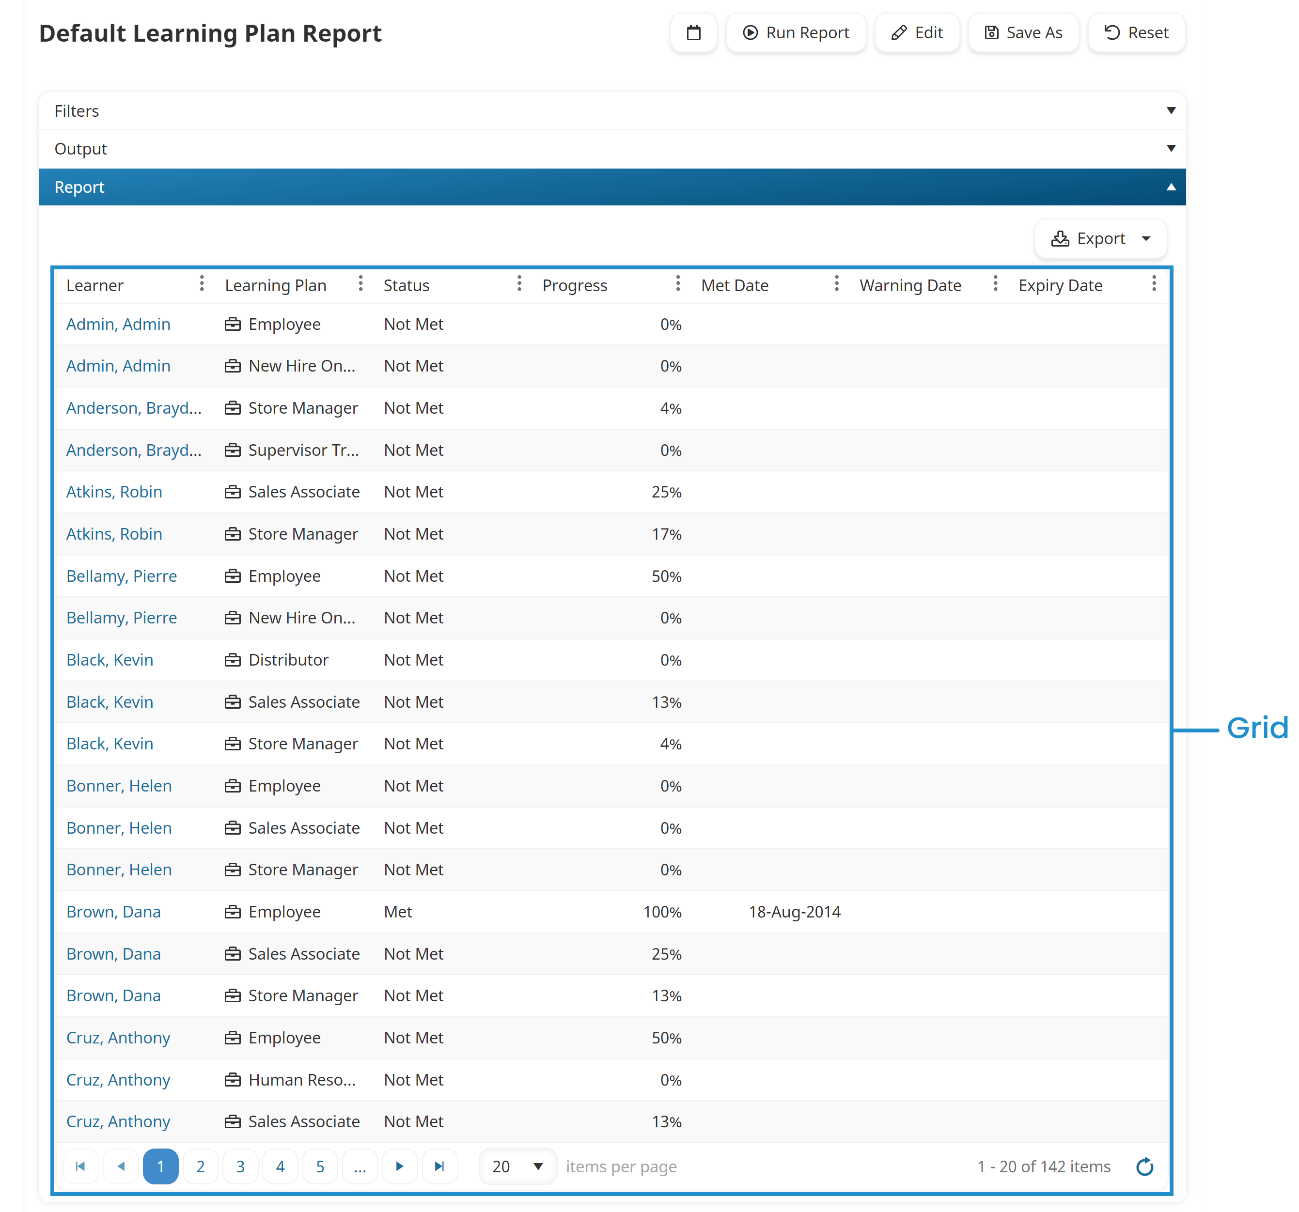
Grids are used throughout SmarterU to display the output of the Learning Plan, Training Cost, Quiz Analysis, and Audit Log reports.
Sorting a Grid's Contents
To sort a grid's contents:
- Run the report.
- Do one of the following:
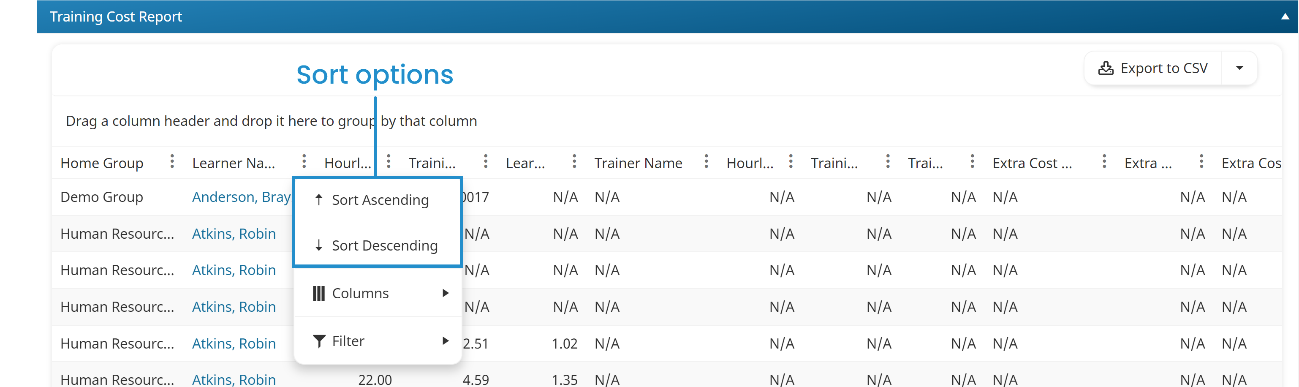
- Click the column header you would like to sort the results by. The first time you click a column header the results will be sorted in ascending order. Clicking the column header again sorts the results in descending order.
- Click the
 beside the column header by which you would like to sort the results and select Sort Ascending or Sort Descending.
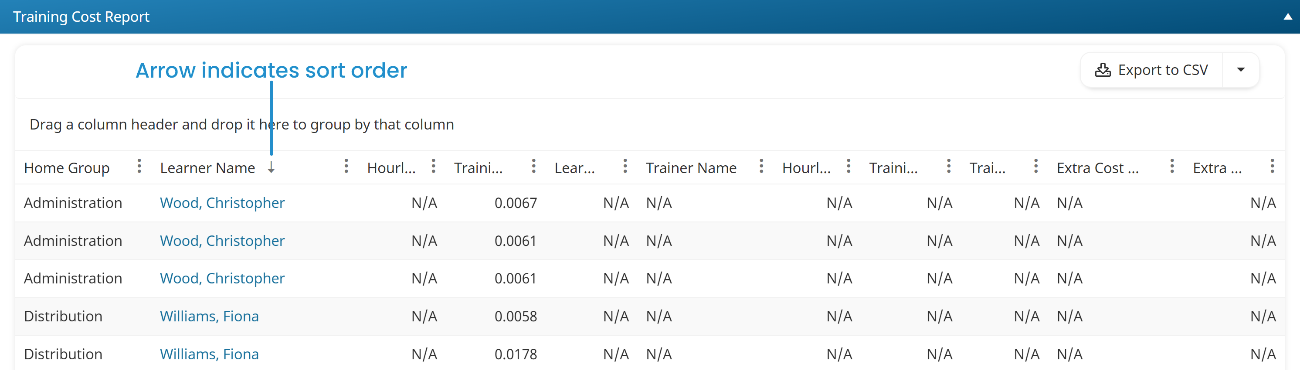
An arrow displays beside the column header to indicate the sort order.
Changing Columns Displayed
- Changing the columns displayed is not a permanent or saved change. The changed columns will only stay in effect while you are on the same page.
- Changing the columns does not affected the exported columns.
To change the columns displayed in a grid:
- Run the report.
- Click the
 in any column header in the grid.
 - From the menu, select Columns.
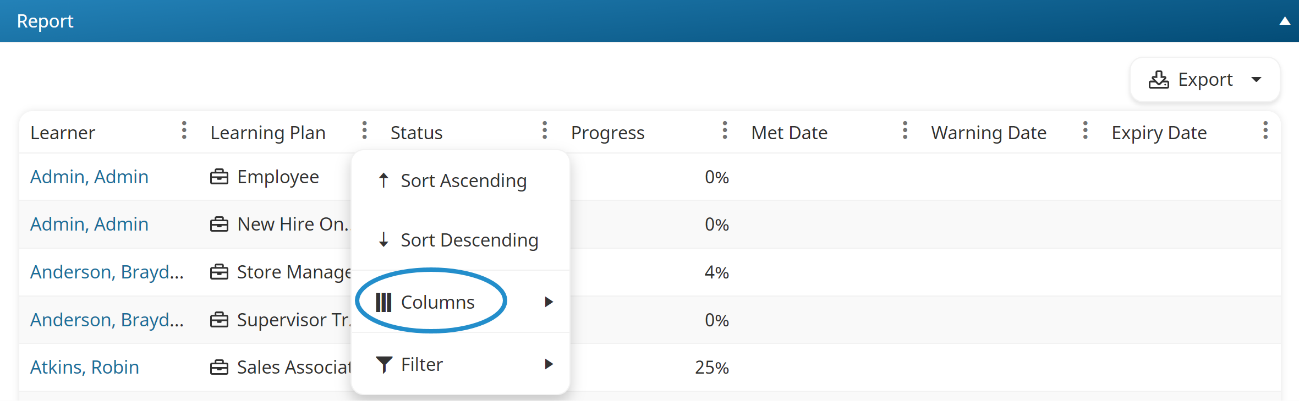
- To include a column in the grid, check the checkbox beside the column name. To hide a column, uncheck the checkbox.
Filtering a Grid's Contents
Filtering enables you to specify criteria so that only those rows that meet your criteria are displayed in the grid. For example, you could apply a filter to the Learning Plans Report so that it only displays learning plans that contain the word "Sales".
- Filters are not available for all columns.
- You may apply filters to multiple columns.
- The conditions that are available will vary based on the column.
To filter a grid's contents:
- Run the report.
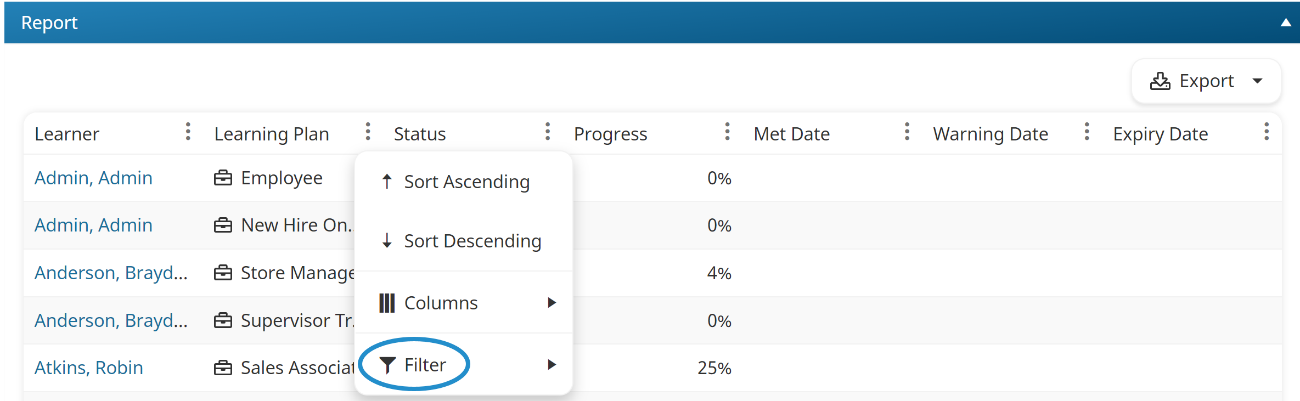
- Click the
 in the column you would like to apply a filter.
 - From the menu, select Filter.
- Select the condition from the Show Items With Values That list.
- Enter the value in the field.
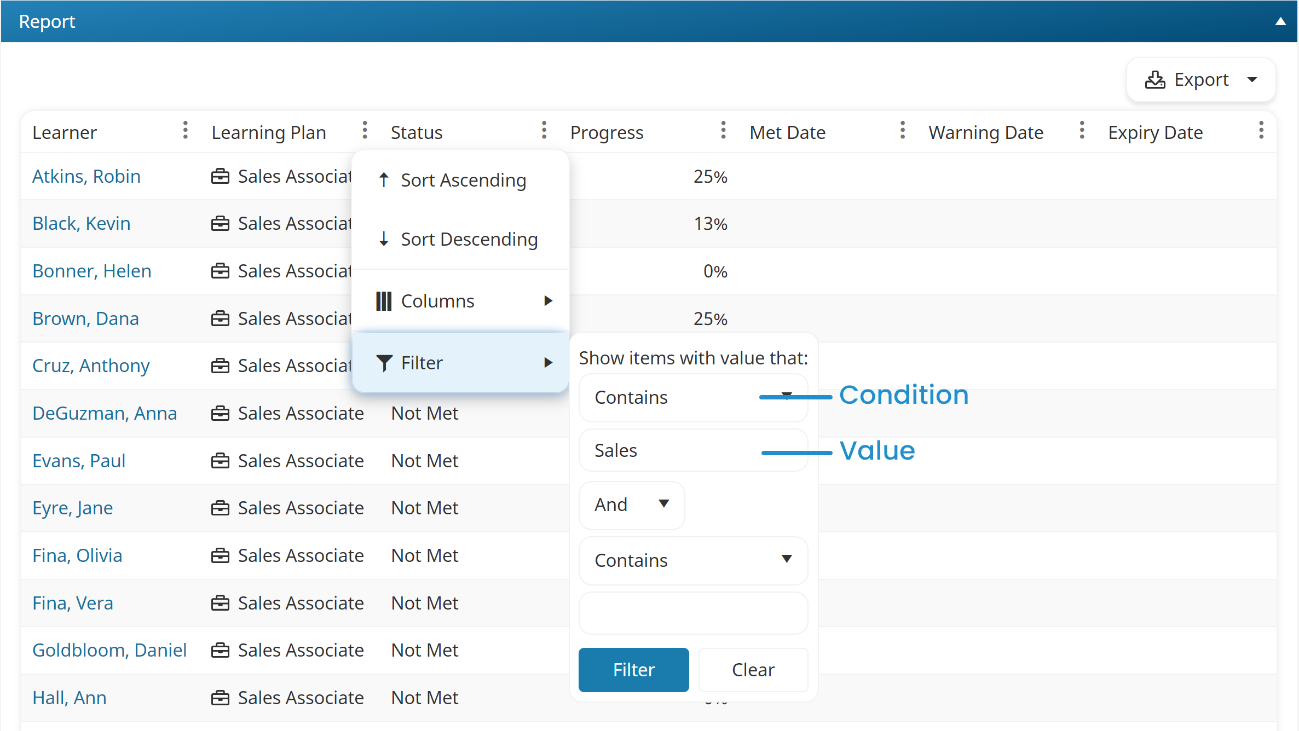
- If you would like to specify another filter:
- Select And or Or from the list. And includes a row if both filters are met; Or includes a row if either filter is met.
- Select the condition from the list.
- Enter the value in the field.
- Click Filter.
Removing Filters
To remove filters from the grid:
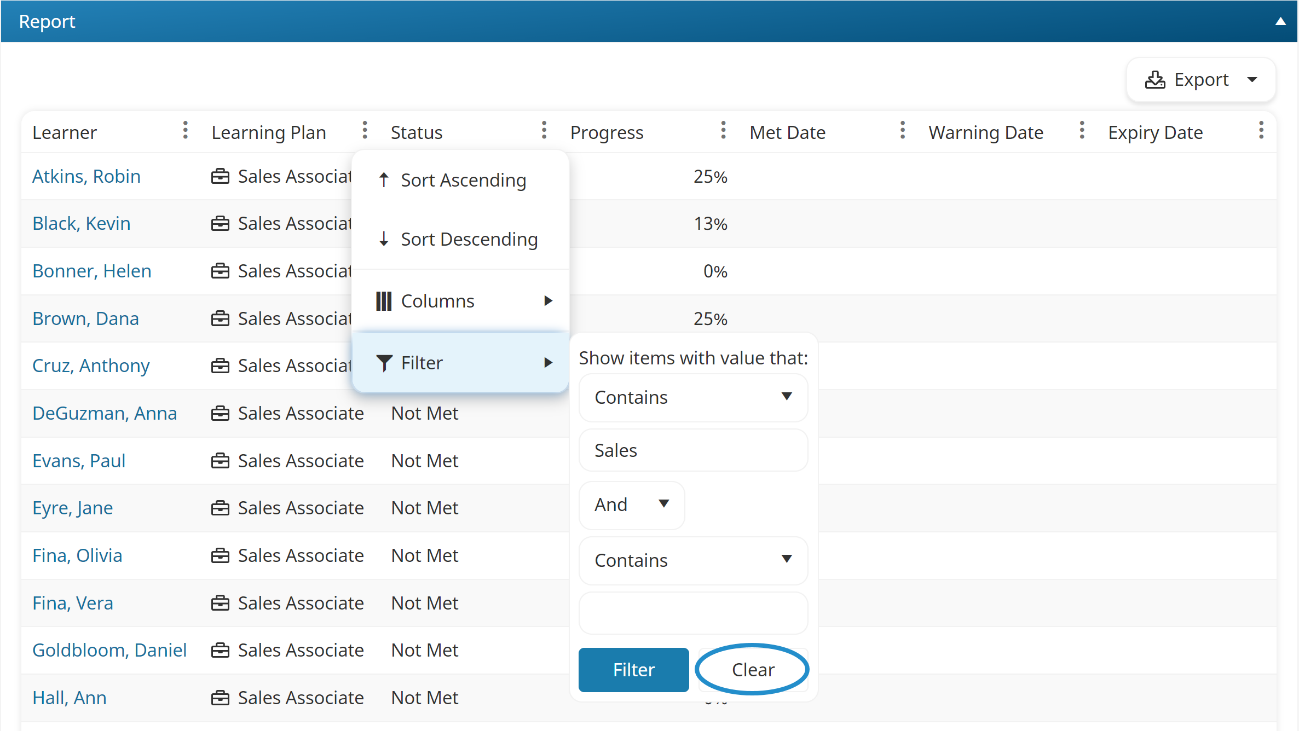
- Click the
 in the column you would like to remove a filter.
 - From the menu, select Filter.
- Click Clear.
Exporting a Grid's Contents
To export the contents of a grid:
- Display the dashboard or run the report.
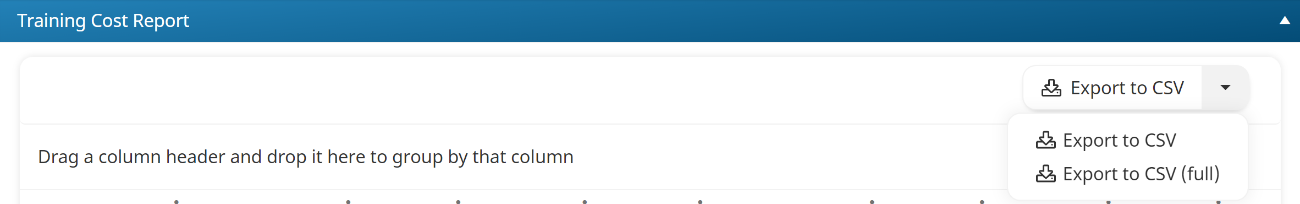
- Select one of the following:
- Export to CSV - exports the columns that are visible in the grid.
For the Quiz Analysis Report, the Export to CSV option exports all available columns (including the ones displayed) for the report.
- Export to CSV (full) - exports all report columns and all user-related columns. For the Quiz Analysis Report, a full export includes correct and incorrect answers.
The Export Notification window displays.
- In the Send Email To field, enter the email addresses of the users who should receive the link to the file.
- Click Confirm.
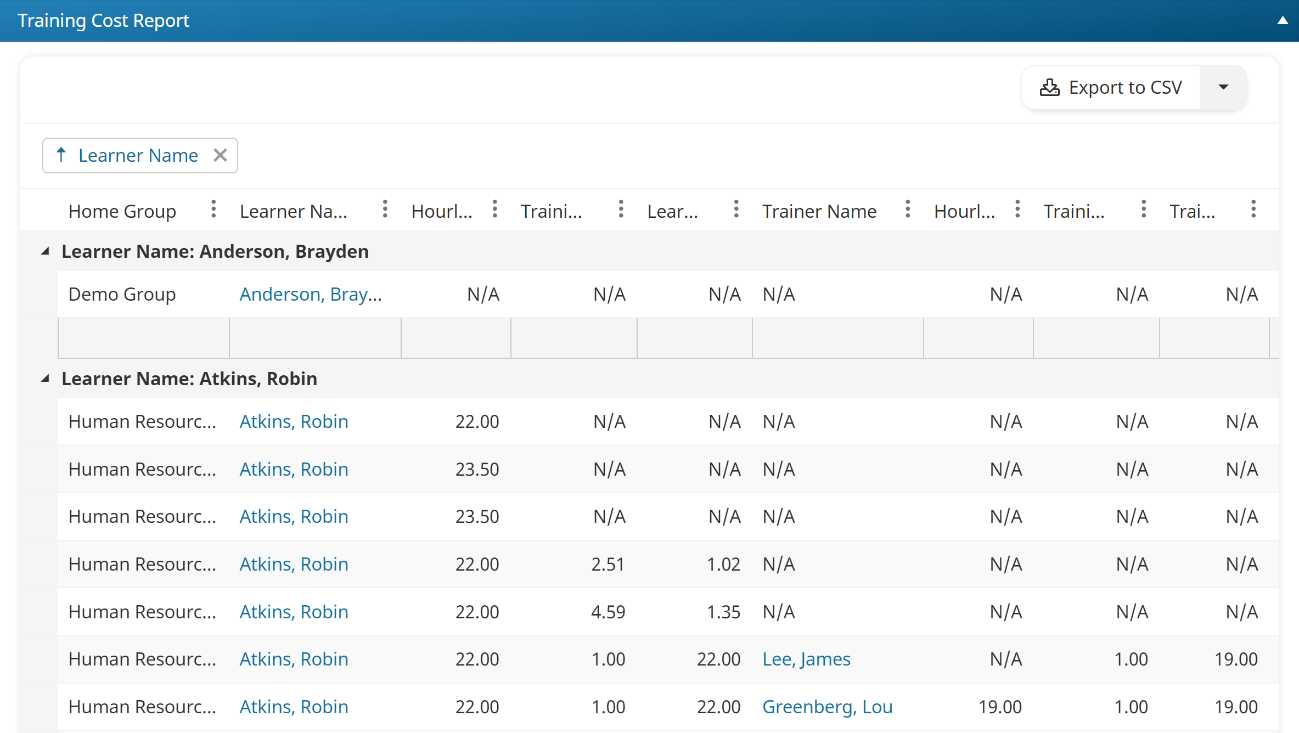
Grouping a Grid's Contents
Grouping clusters the grid's contents using common values of a selected column. For example, you might want to group your report's results by Course Name to view sub-totals for each course.
- You may only select text columns for grouping.
- You may only group results by a single column.
- Grouping is only available for the Training Cost Report.
To group a grid's contents:
- Run the report.
- Click the column header that you would like to use for grouping.
- Drag the column header to the area above the grid.
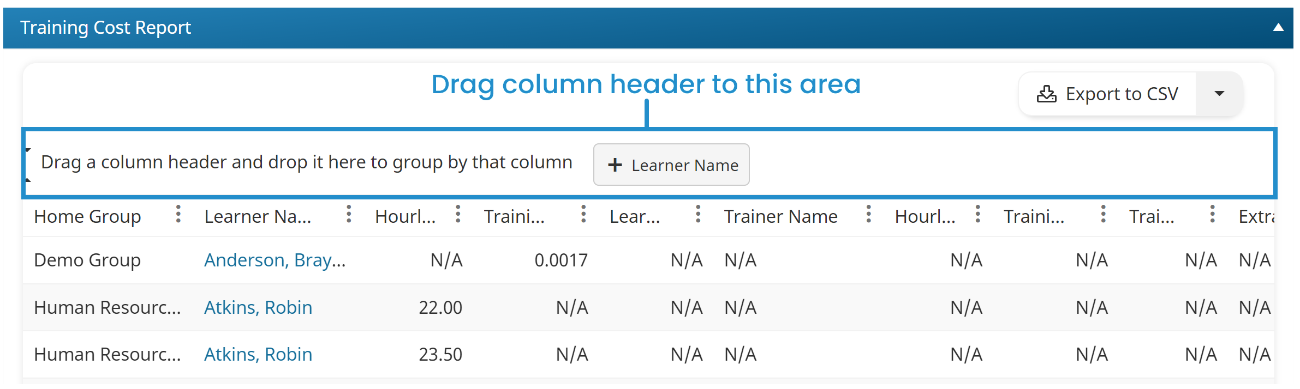
The contents are grouped by the selected column.