As an LMS administrator, you spend a lot of time creating and curating content for your learners. But how do you know if it's effective? One way is by doing regular content audits.
A content audit is a detailed review of your existing learning materials with the goal of determining what resonates with your learners and what falls short. It's a crucial step in ensuring that your training delivers real value.
We've previously discussed how you can use the KB Report to improve your knowledge base content. In this post, we'll explore how you can use SmarterU's powerful Enrollment Report to conduct a thorough audit of your courses.
Want SmarterNews delivered to your inbox? Subscribe today!
The Enrollment Report
The Enrollment Report is your go-to tool for understanding how learners interact with your courses. It is an excellent source of information for your content audit, providing a high-level overview of who is enrolled in what and how they're progressing.
This report includes information about learners' enrollments in online and SCORM courses, as well as instructor-led (ILT) courses where the session they attended has been finalized.
You can set up a custom Enrollment Report from the Reports Dashboard, using filters and columns to focus on key metrics related to your content. By focusing on a few metrics, you can quickly identify what’s working, what isn’t, and where to make improvements.
Let’s take a closer look at some of these critical metrics, what they mean, and how you can use them to inform your next steps.
Completion Rate: Are Learners Finishing the Course?
A quick way to assess how your courses are performing is by examining their completion rates. Put simply, this is a measure of the number of learners assigned a course who completed it.
What you want to look for are courses that have many enrollments with a status of Not Started or Overdue, especially those that learners start but do not finish. A low completion rate often indicates that the course is too long, too challenging, or not engaging enough. It can also suggest that learners are not seeing the value in taking the course or that a technical issue is preventing them from completing it.
Actionable Next Steps
When a course has a low completion rate, we recommend the following.
Consider if learners were recently assigned the course. If this is the case, the issue may be that learners haven’t had sufficient time to complete their training, rather than a problem with the content itself.
Review the course’s structure. If the course is very long, consider breaking it up into smaller, more manageable microlearning modules.
Add elements to boost engagement. If the course primarily consists of text, consider including knowledge checks or activities that allow learners to apply their knowledge immediately.
Gather feedback by asking learners who didn't complete the course where they got stuck or how they would like to see the course improved.
Consider using a SmarterU form to gather feedback from all your learners, allowing you to quickly identify any content issues that may arise outside of your regular content audits.
If you are delivering training through a SCORM course, ensure all videos, buttons, and interactivities are working correctly. While technical issues are rare, you want to guarantee a seamless experience.
Test the course on various devices and browsers to ensure a smooth, uninterrupted learning experience for all users.
Use the Enrollment Report
The easiest way to view this information in SmarterU’s Enrollment report is to set the report's output to a chart. Specifically, set the Chart Type to Stacked and set Group Output By to Course.
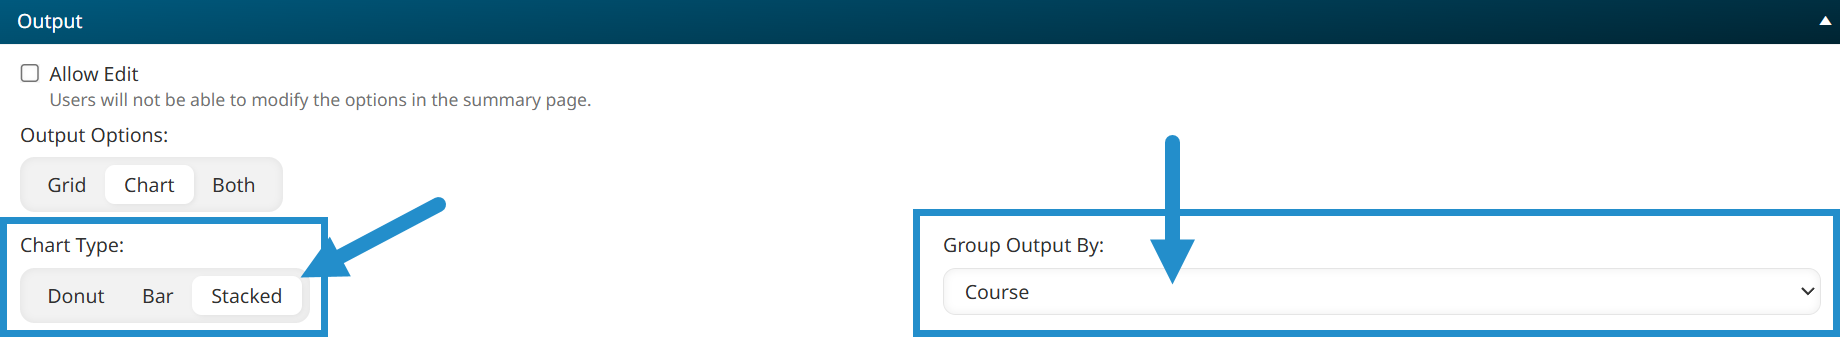
The smaller the green section of the bar, the lower the course's completion rate.
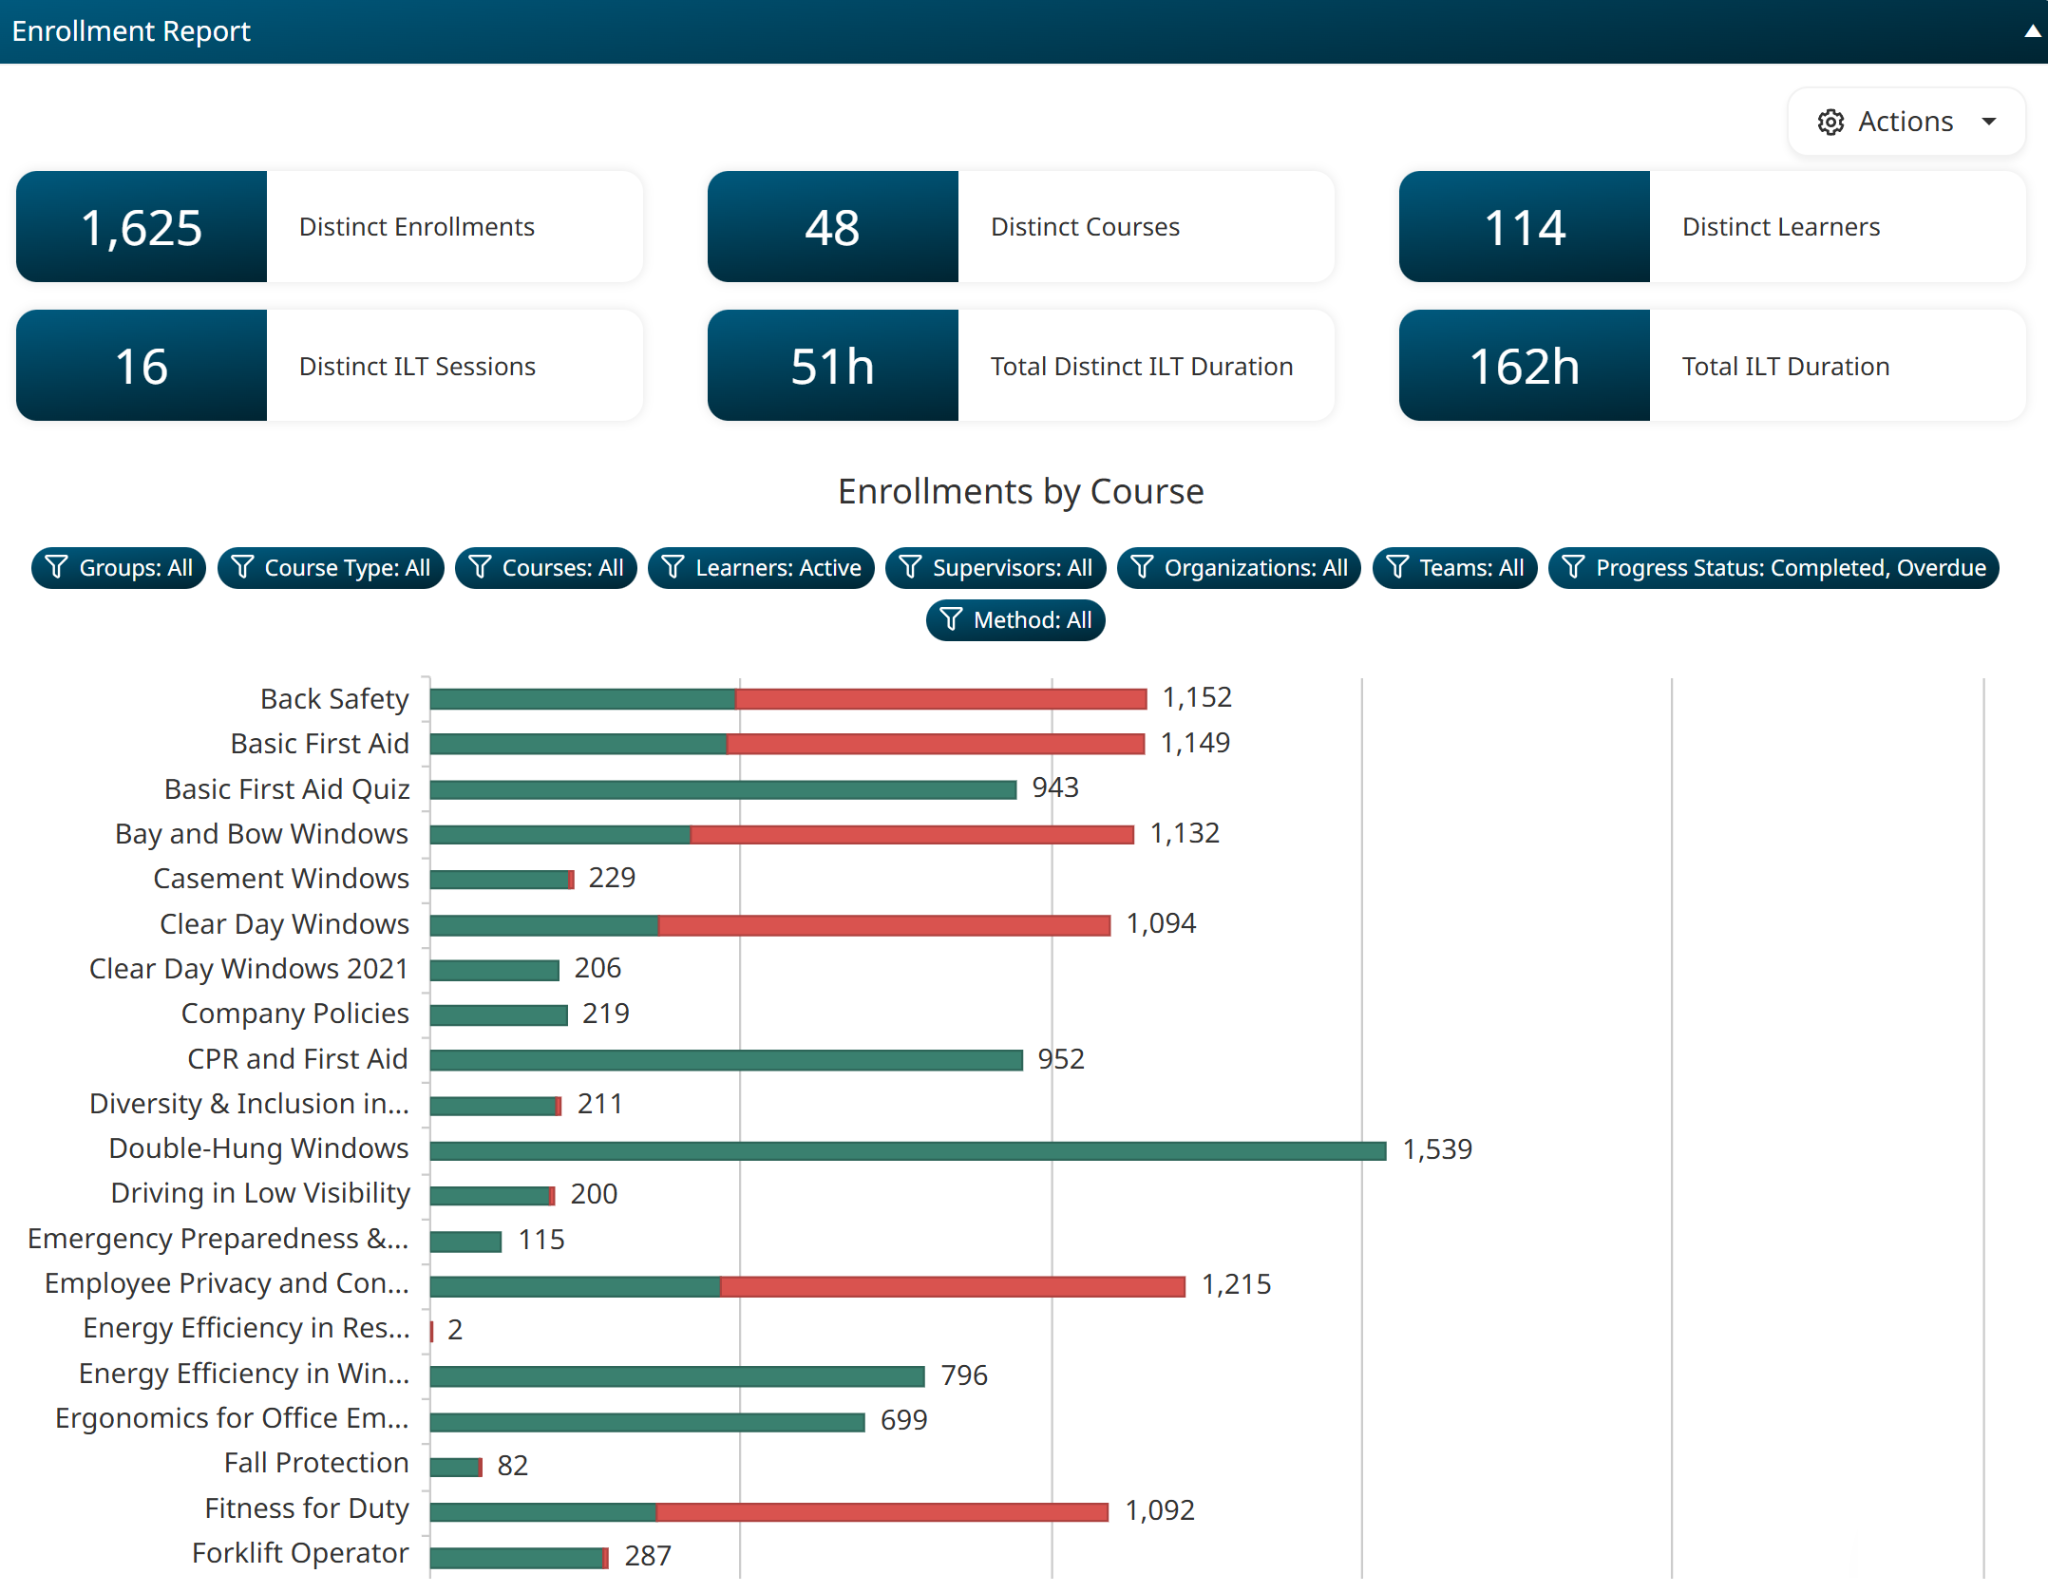
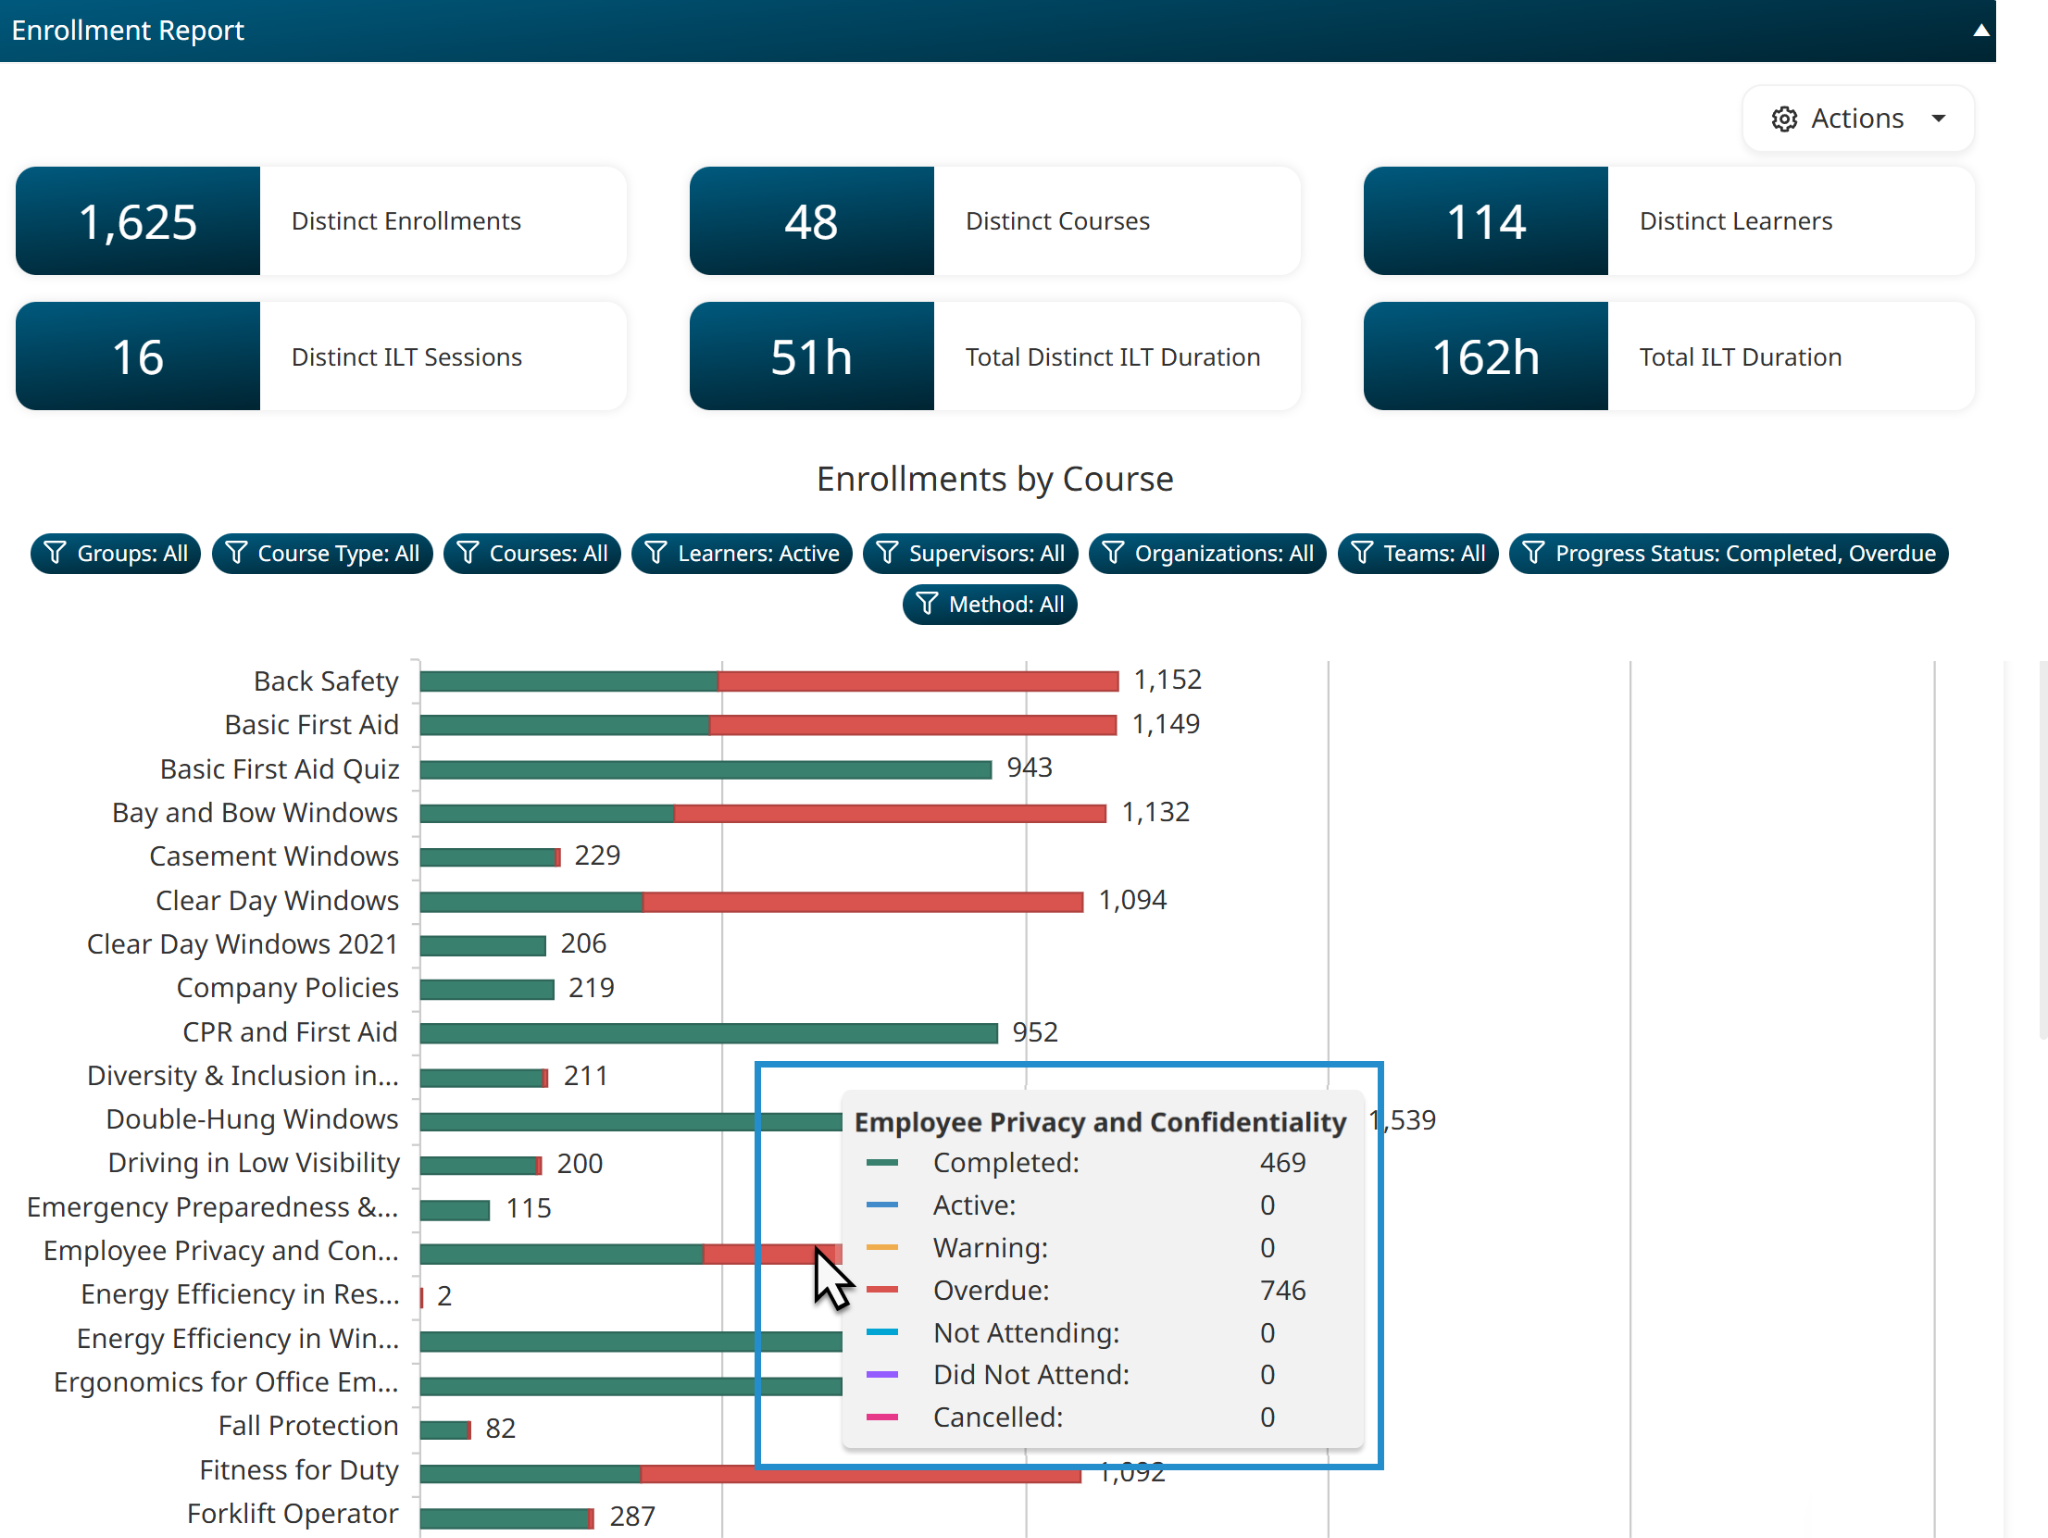
Hover over a bar in the chart to see more specific metrics.
To refine your report to a specific list of courses or time period, add filters to your report.
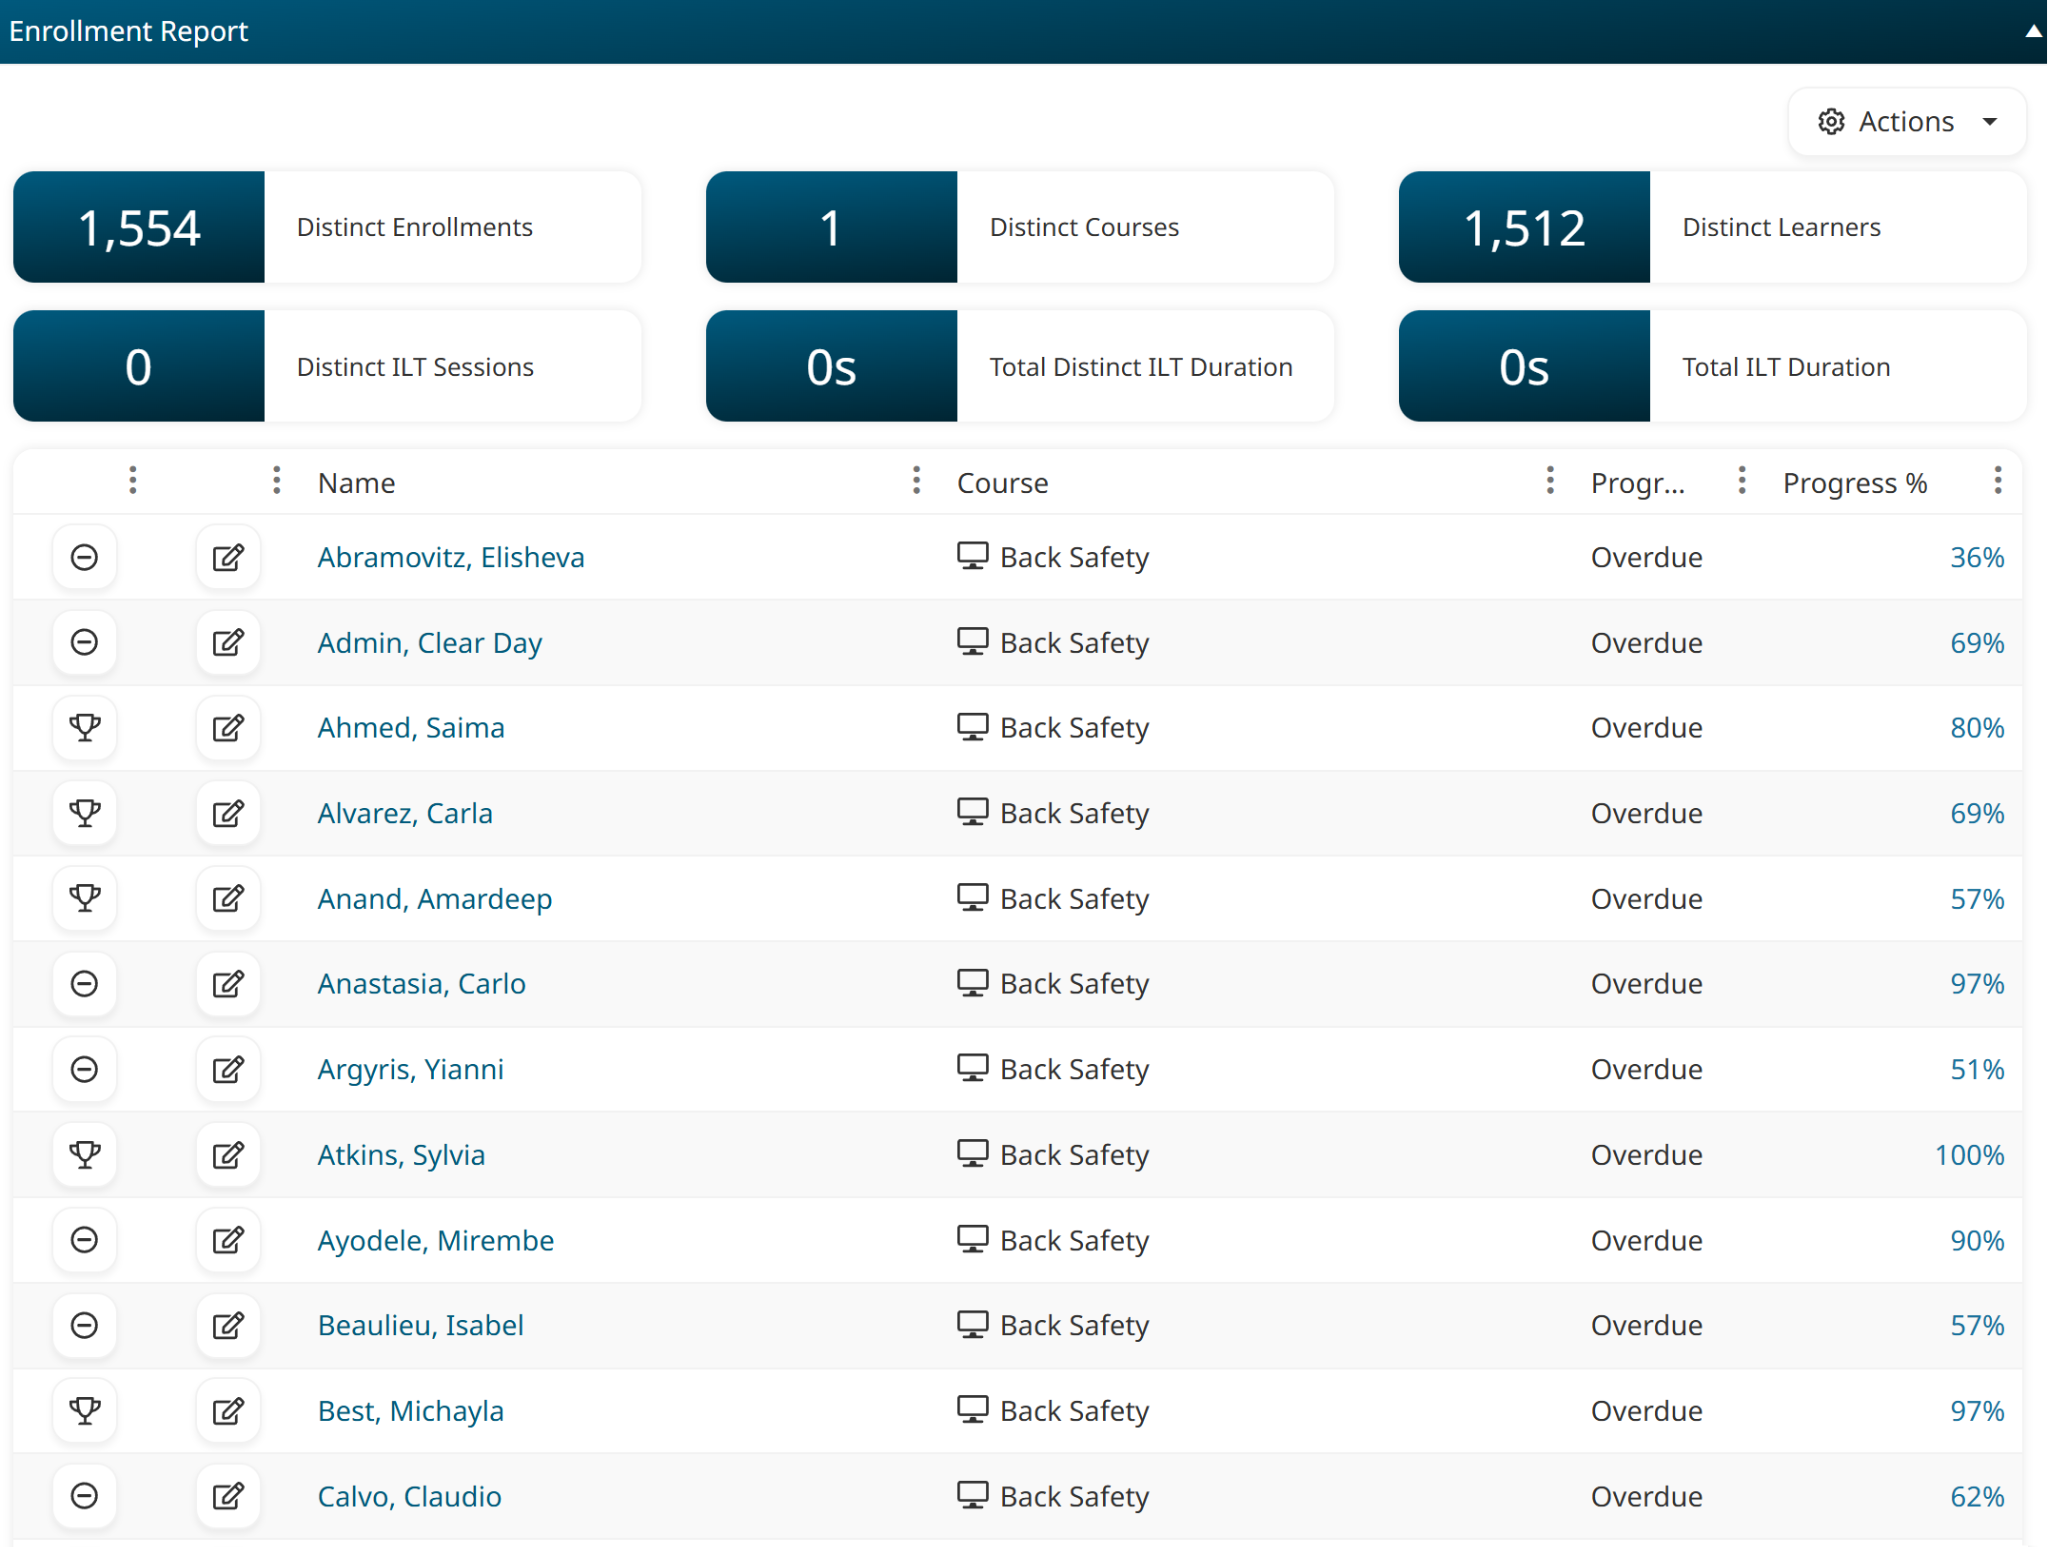
After identifying which courses have low completion rates, get more details by running an Enrollment Report for each course, including the Progress Status and Progress Percentage columns in your report. This information allows you to pinpoint precisely where learners are struggling. For example, if many learners are stopping at the same percentage, you've found the problematic chapter or topic.
Average Grade: Are Learners Understanding the Material?
After investigating whether learners are completing a course, the next step is to look at their average grade. This metric indicates whether those who completed the course actually understood it.
Look for enrollments where the average score is near the passing threshold, or where learners require multiple attempts to pass. A low average grade strongly suggests the associated course content is either too complicated, confusing, or doesn't align well with the final quiz.
Actionable Next Steps
When a course has a low average grade, we recommend the following.
Revisit content alignment. Ensure final quiz questions reflect the key learning objectives and content presented in the course. A low average grade can indicate that learners are being tested on material that isn’t adequately covered.
Add reinforcing elements. If a topic is complex, consider explaining it in simpler terms or providing more examples. It can also be helpful to include a diagram, add a video, or present a practice activity to reinforce their understanding before the final quiz.
If the course was built using SmarterU’s Online Course Builder, analyze the quiz using SmarterU’s Quiz Analysis Report to identify which questions are consistently tripping up learners. This report can highlight poor questions and knowledge gaps in your teaching material.
Use the Enrollment Report
While the Quiz Analysis Report dives into question quality, the Enrollment Report allows you to identify overall grade trends.
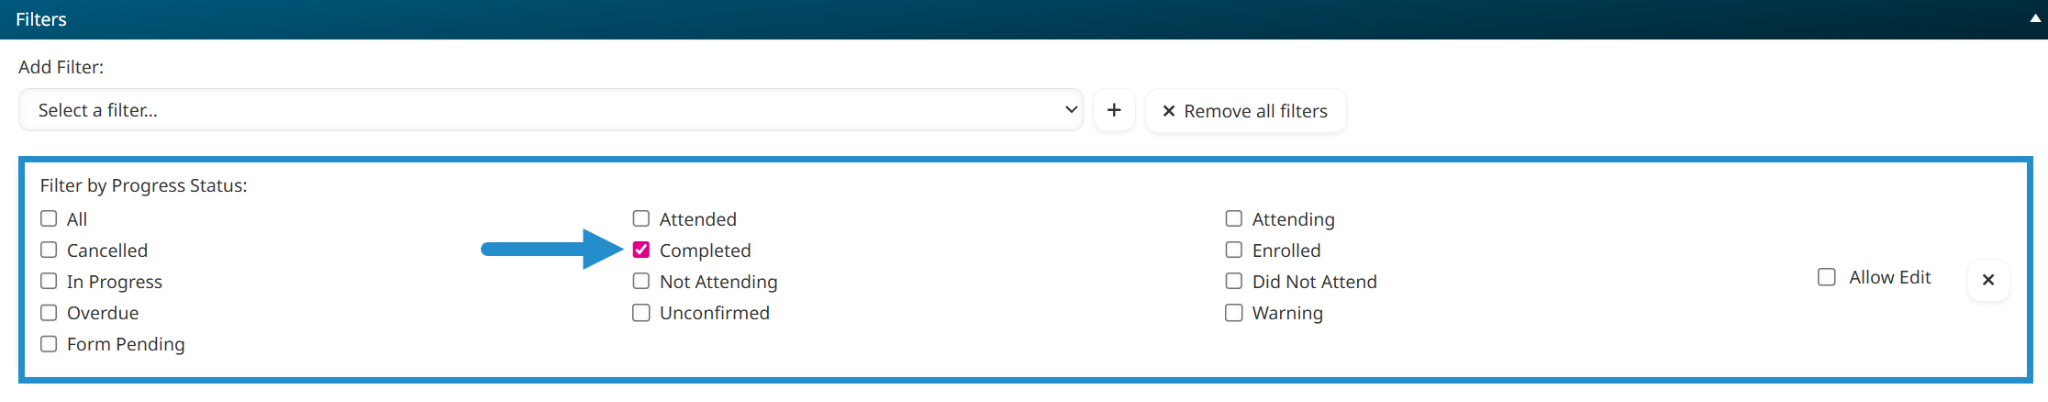
The easiest way to view this information in the Enrollment Report is to set the report's filters to show enrollments with a Progress Status of Completed.
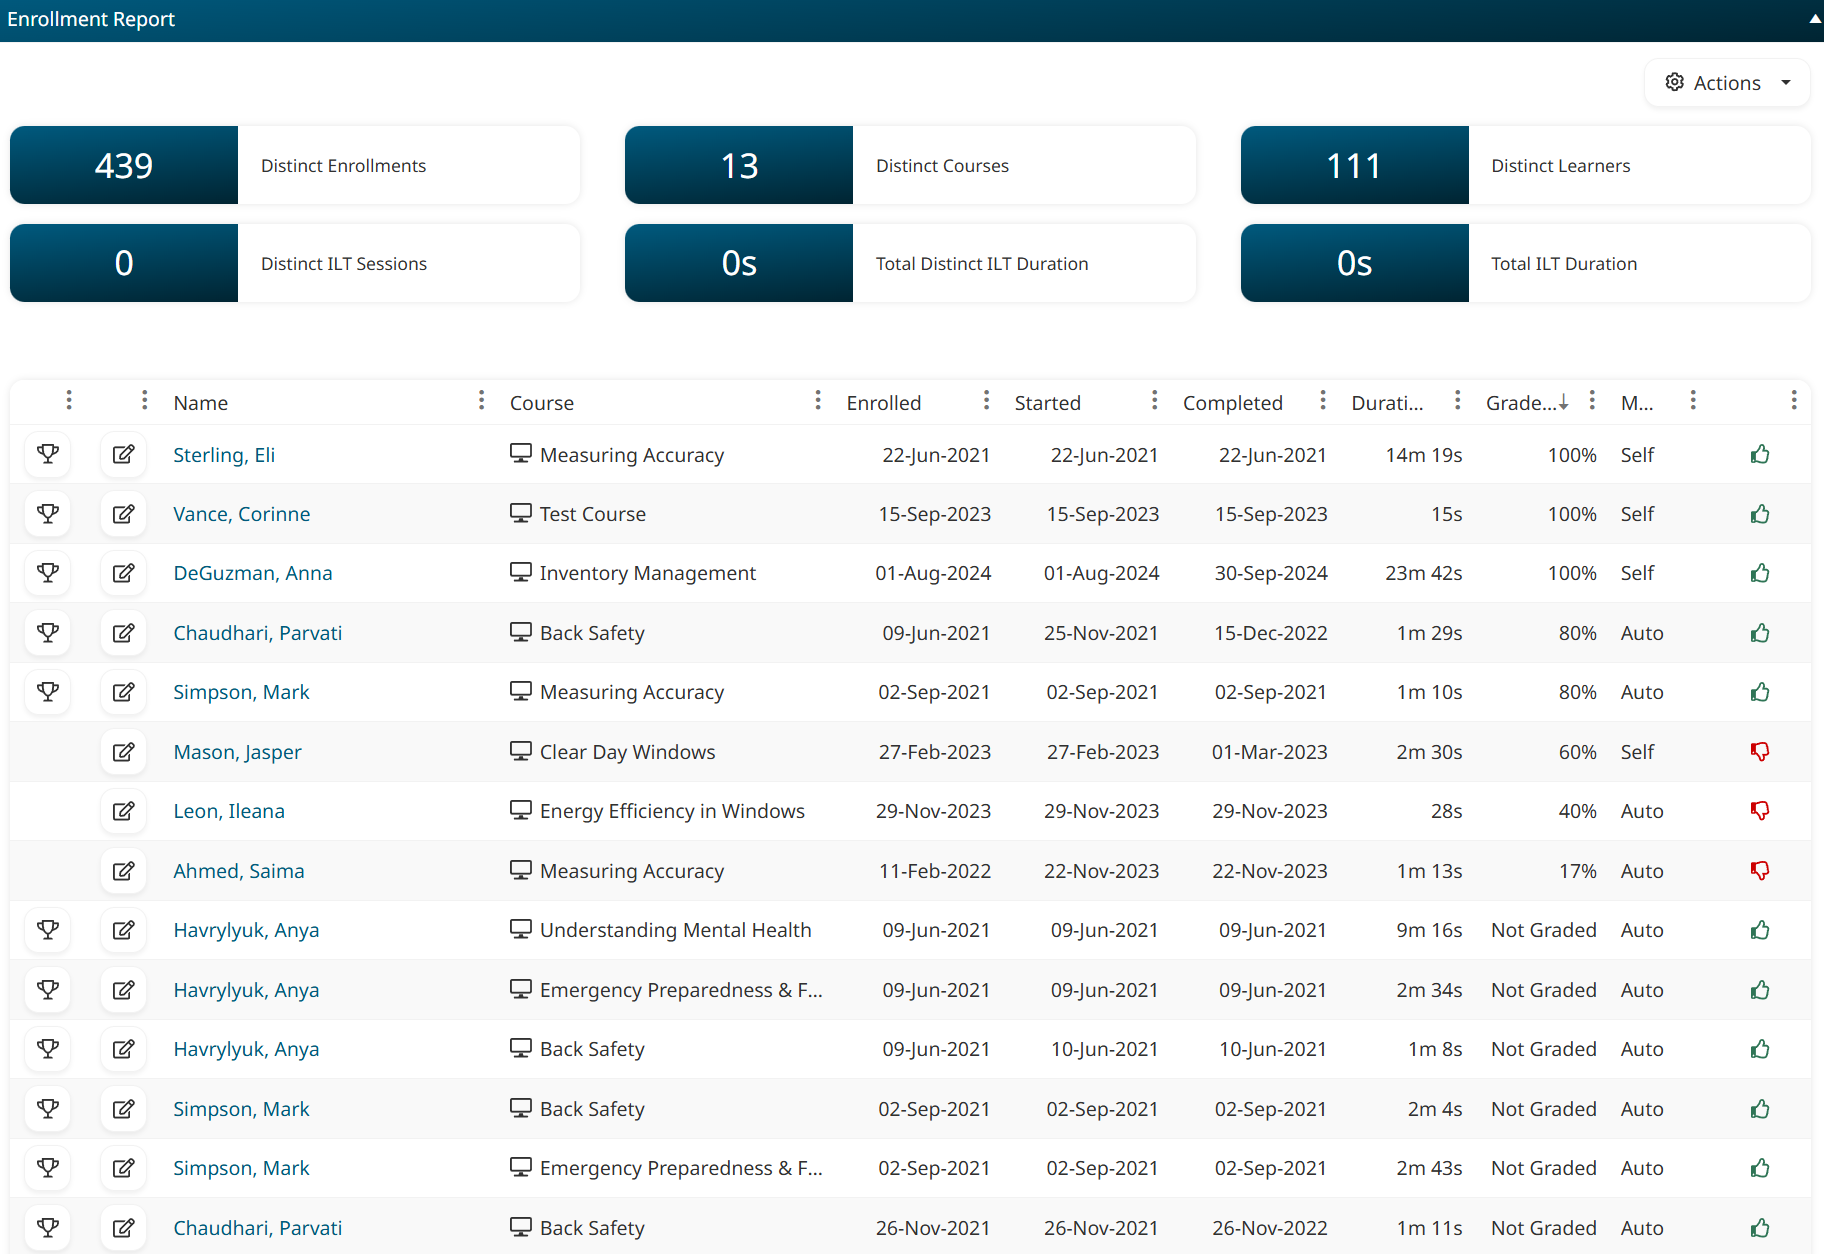
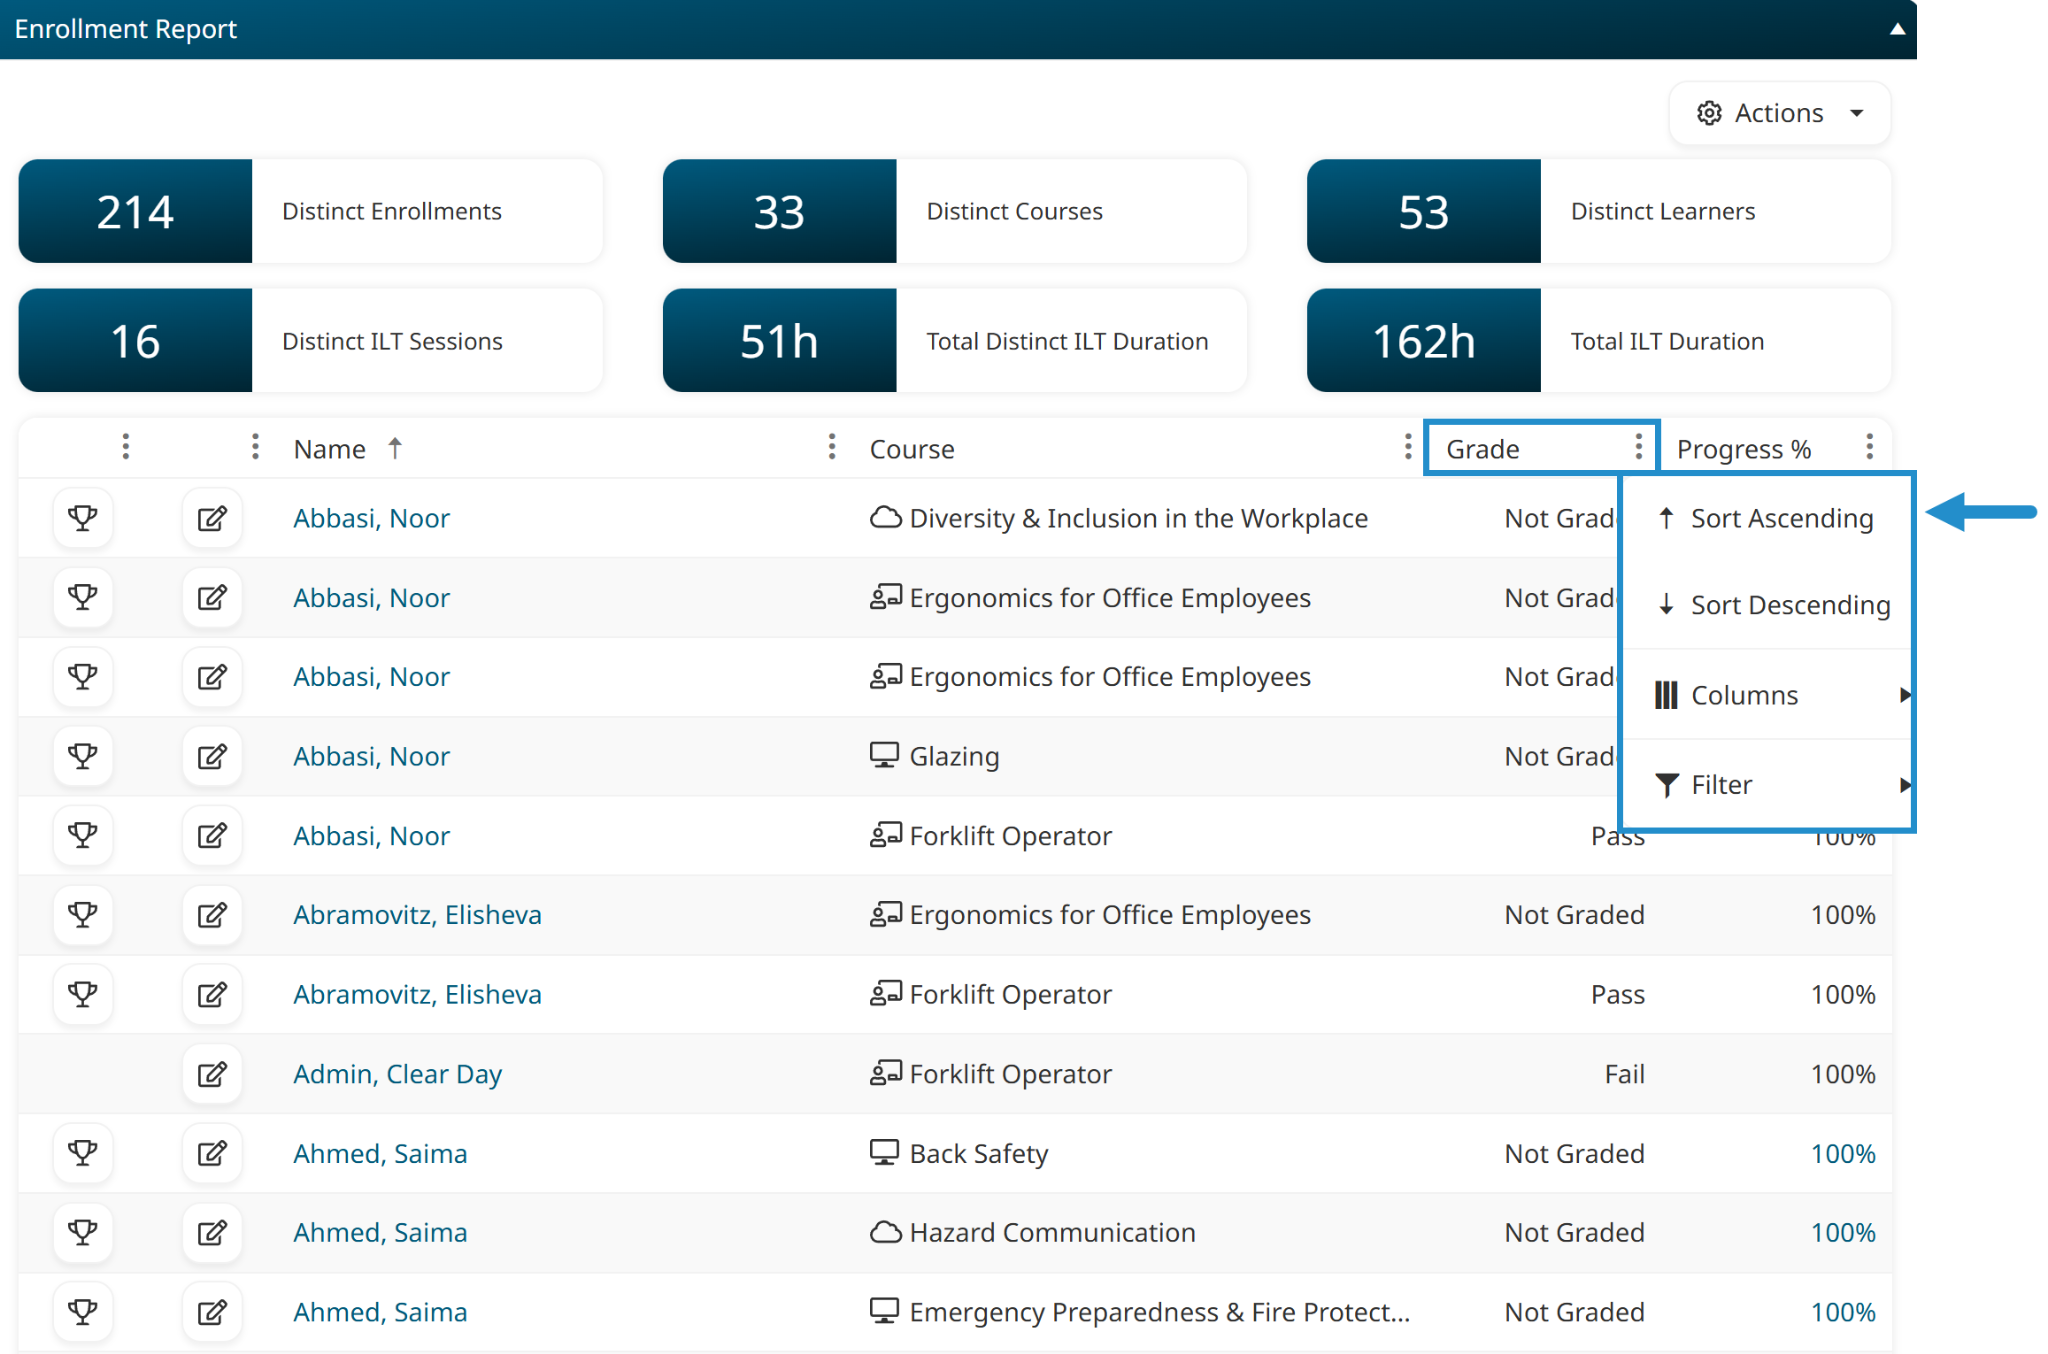
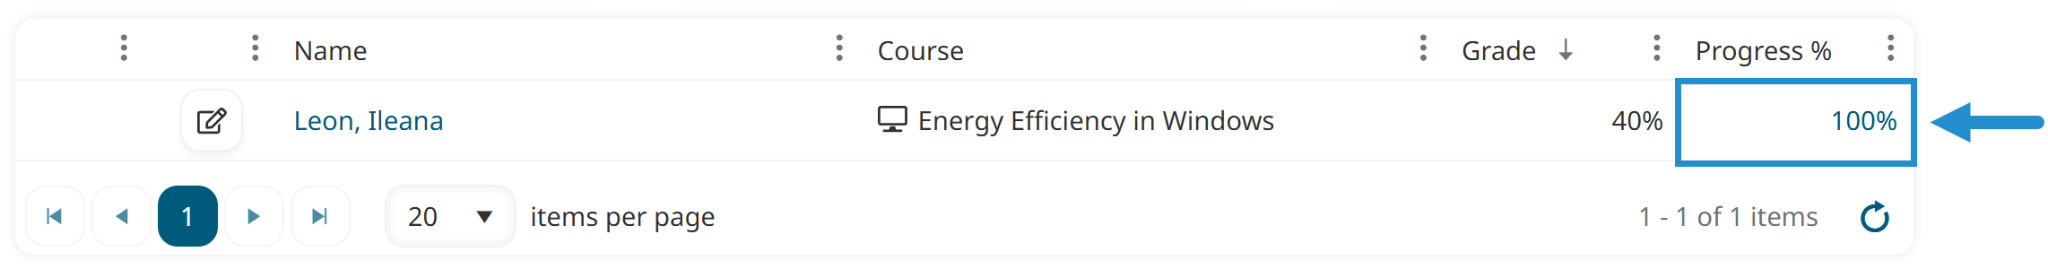
Then, include the Grade and Progress Percentage columns in your report and sort the report by the Grade column to easily see which learners barely passed or failed.
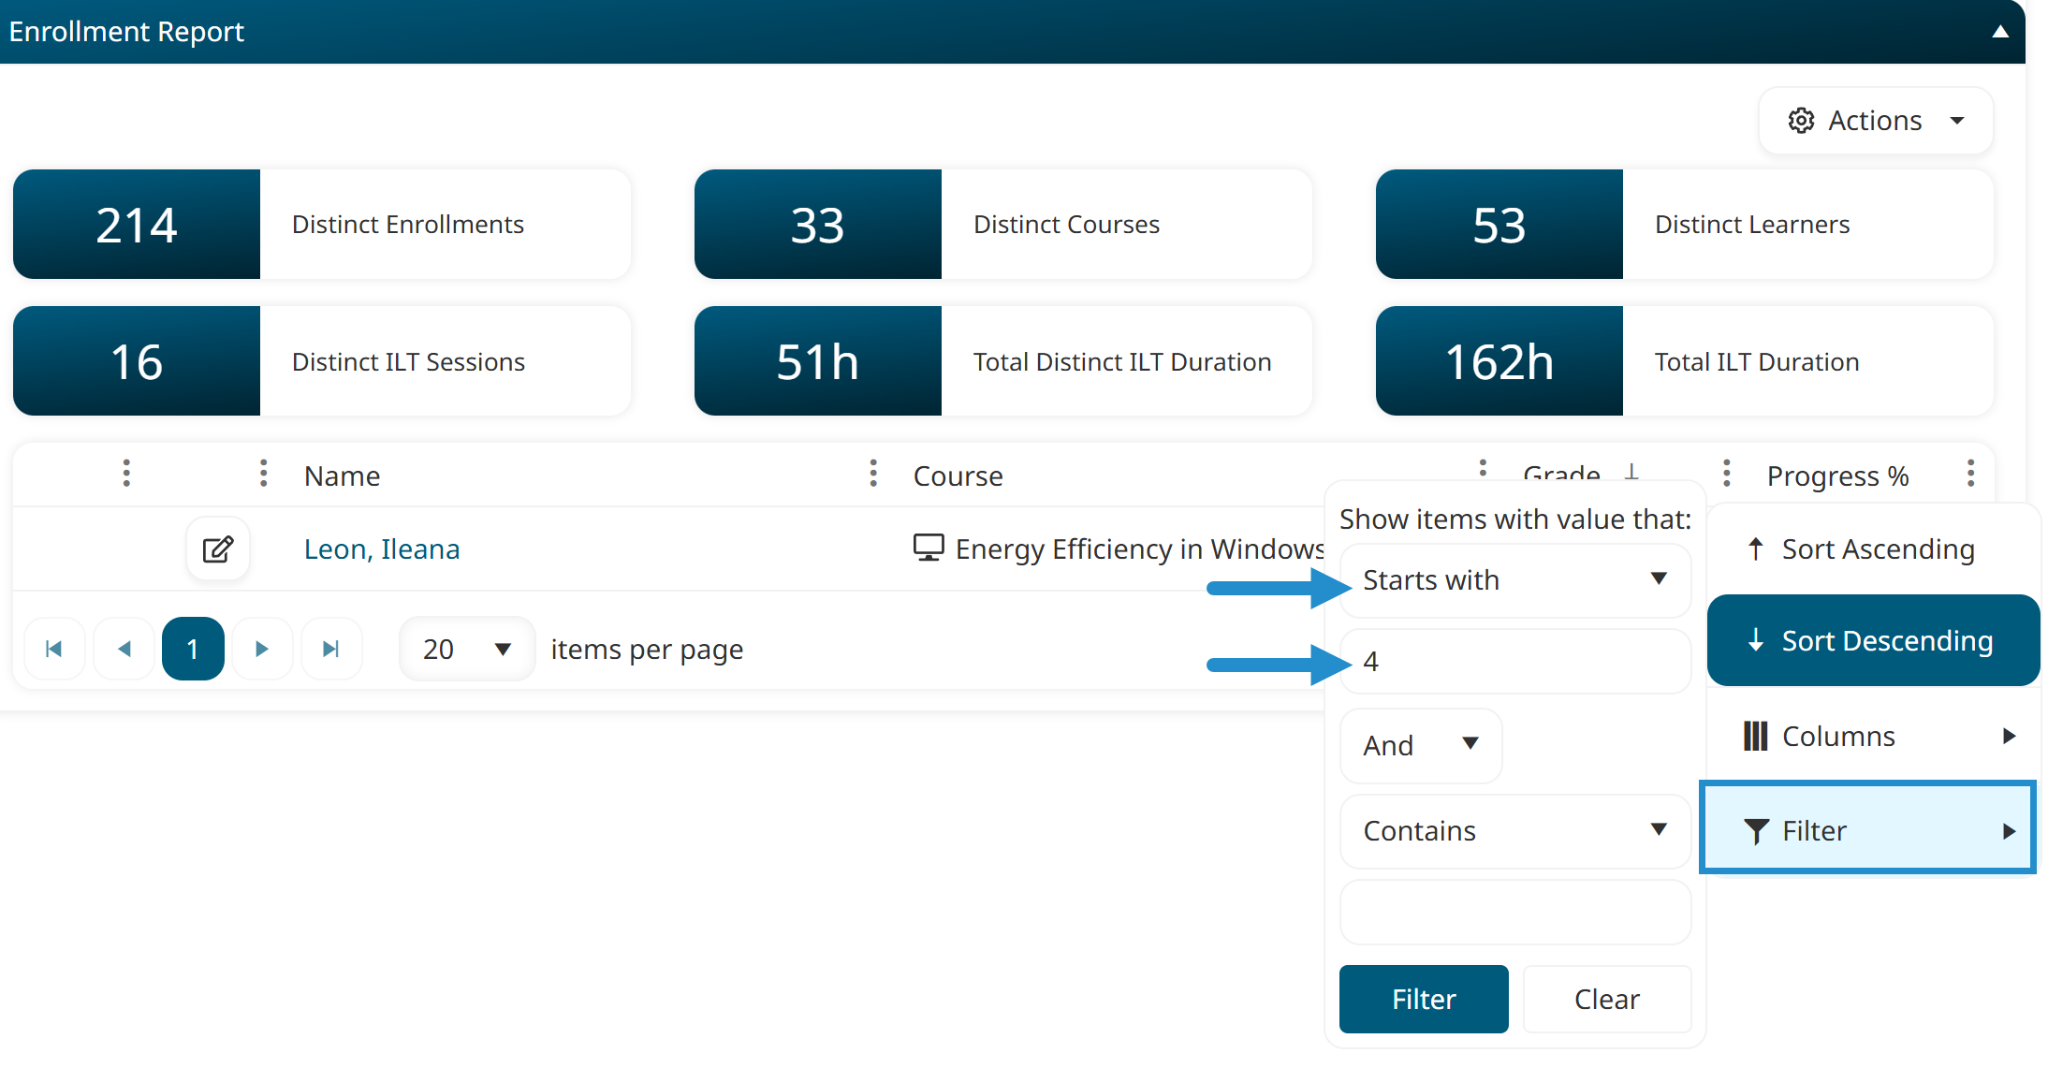
You can also add a filter to the grade column to limit the report to learners who achieved a certain grade. For example, you can set the filter to Starts With and 4 to show all learners who scored between 40-49%.
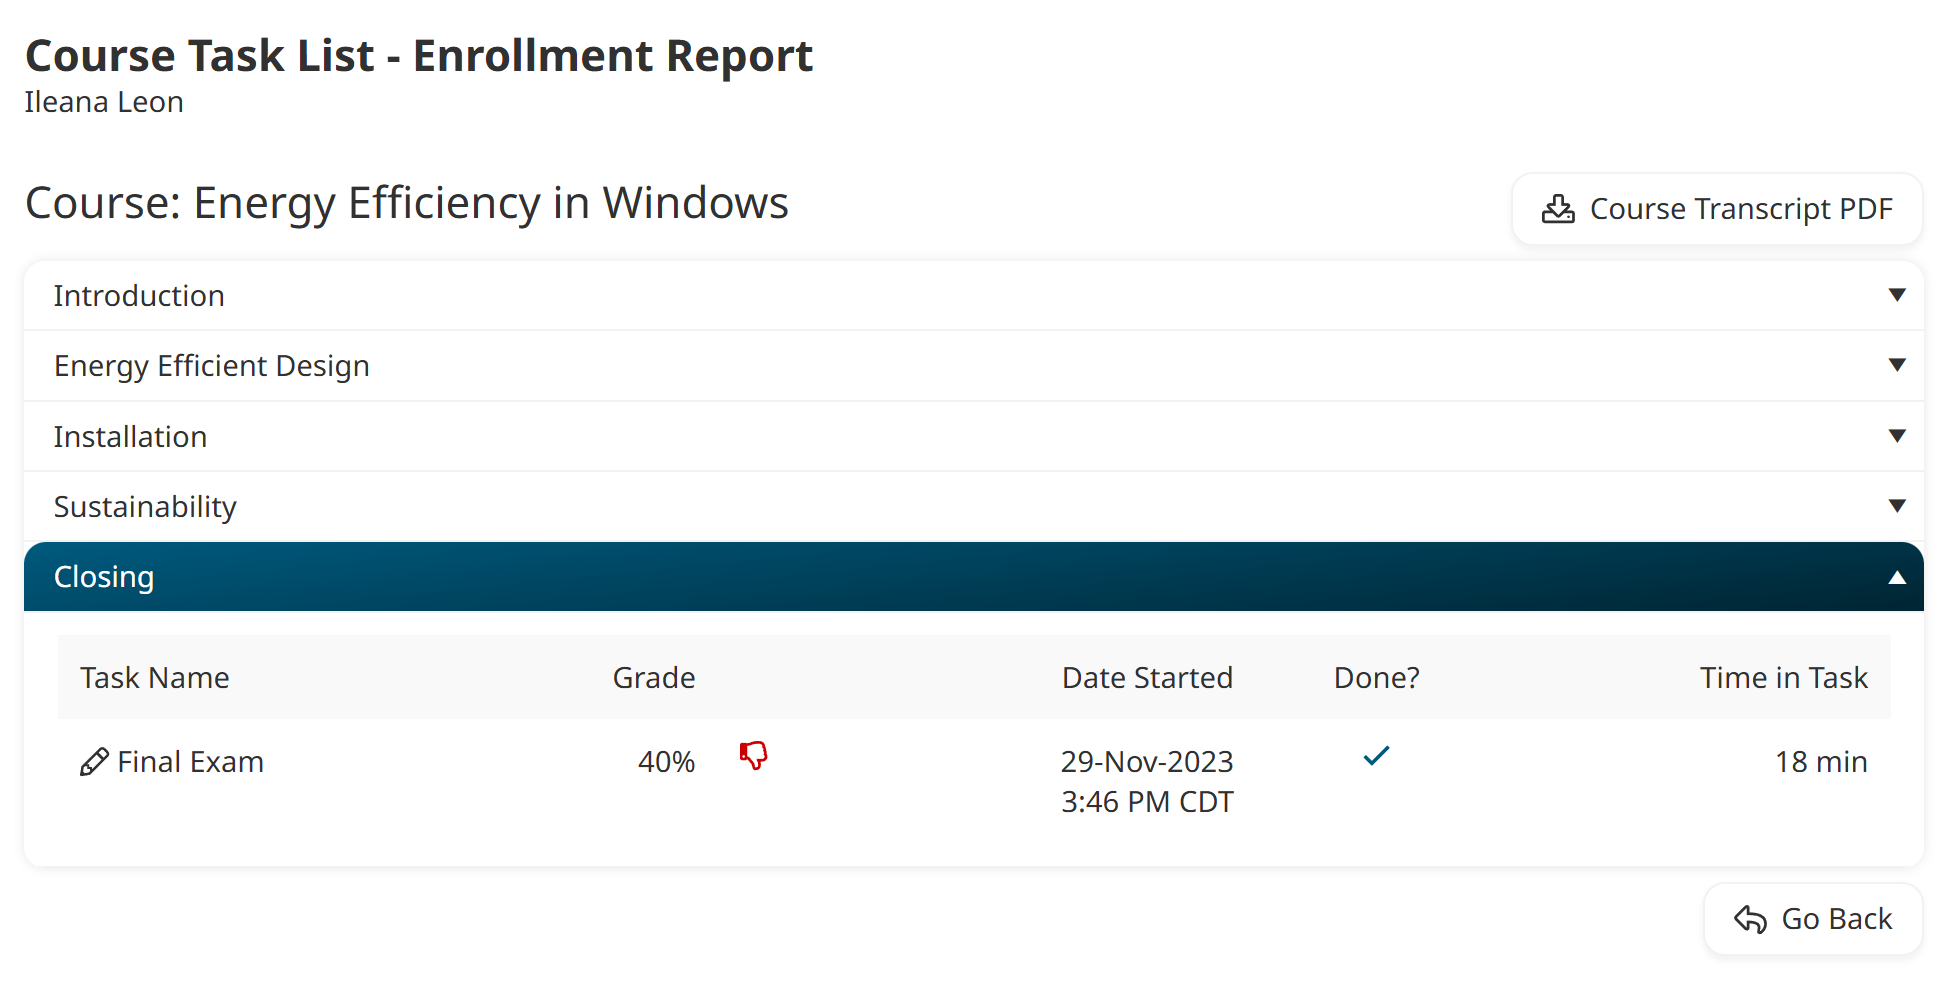
For learners with low grades in online courses built in SmarterU, click the number in the Progress Percentage column to view details about their enrollment.
From this page, called the online course task list, you can see how much time the learner spent on each slide in the course and their grade on each quiz attempt.
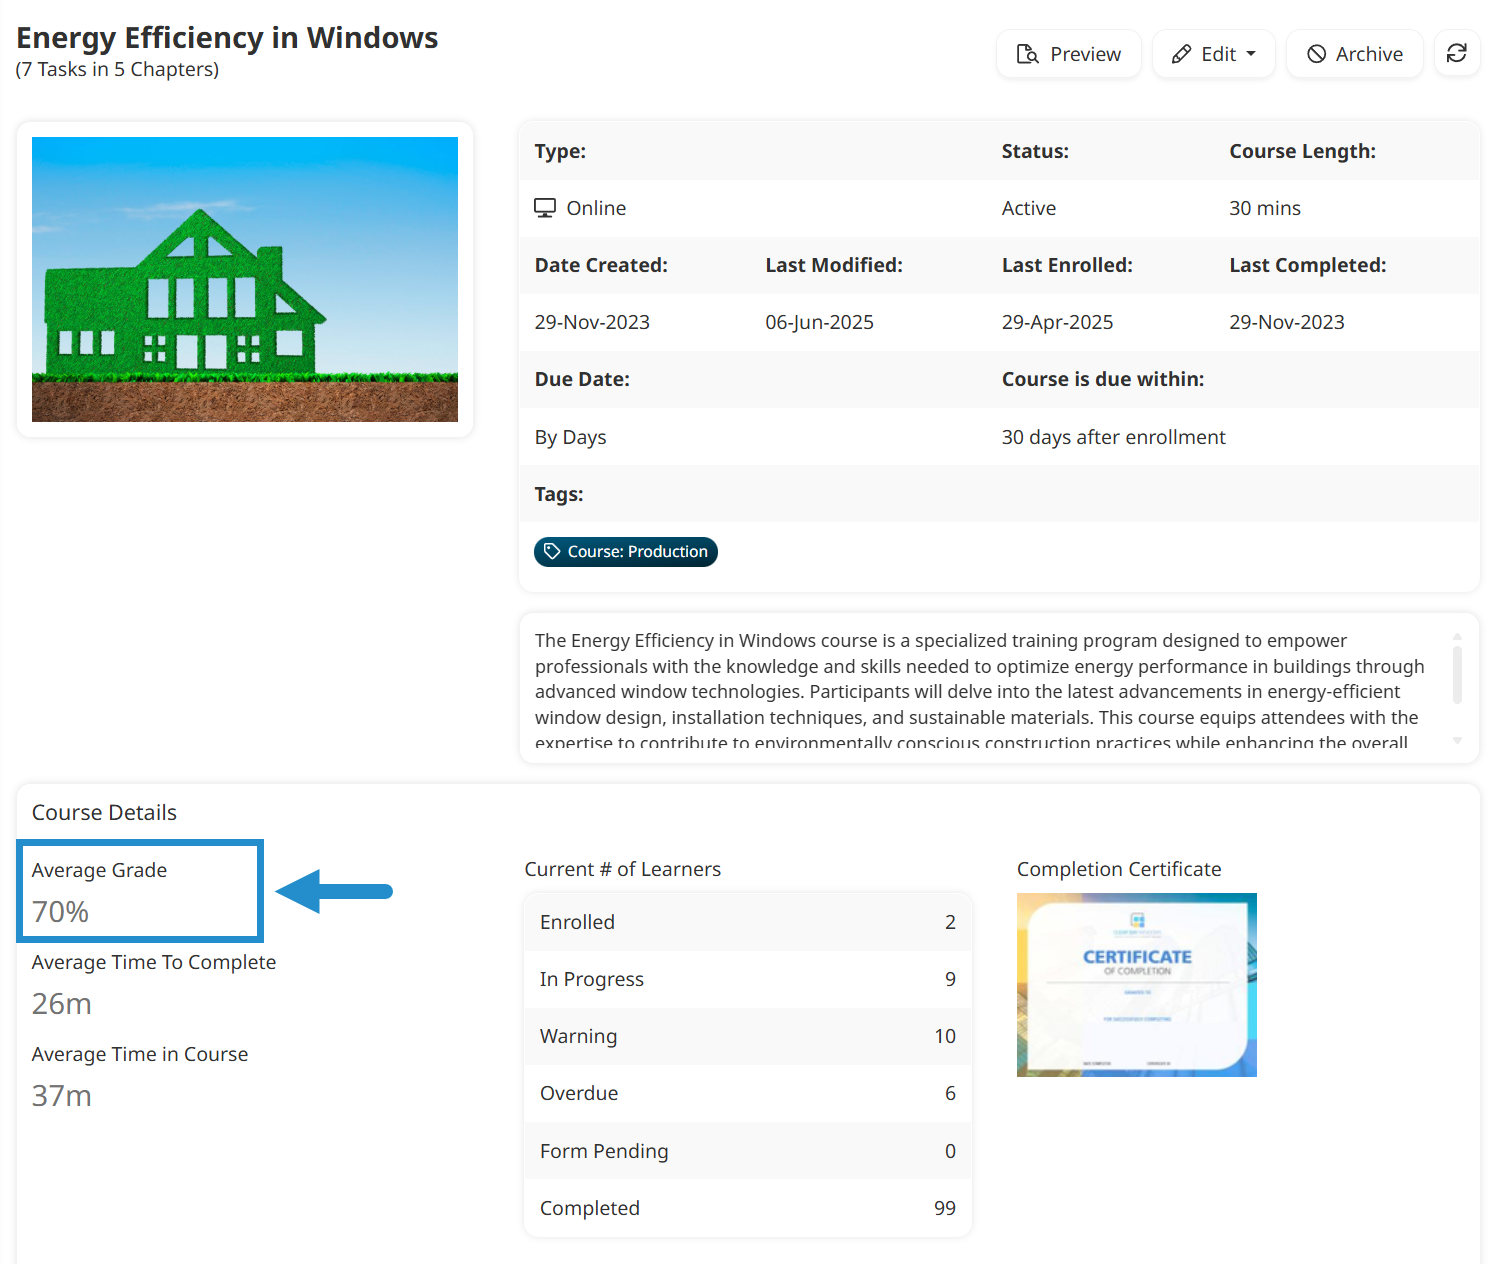
You can also view the average grade for a course from its details page, accessible from the Courses Dashboard.
Putting It All Together
As you can see, the Enrollment Report does more than just show you numbers; it tells you a story about your learners' experience and the effectiveness of your content. By tracking and analyzing key metrics—such as completion rates and average grades—you can transition from simply launching courses to actively improving them with data-driven confidence.
Remember, a low completion rate often indicates issues with course length, learner motivation, or technical clarity. A low average grade typically highlights problems with content complexity, quiz preparedness, or quiz questions themselves.
By conducting regular content audits using SmarterU’s Enrollment Report, you can unlock the metrics you need to identify which courses are performing well and which may need a second look. Using these insights, you can then make data-driven decisions that improve your content and boost learner success.
Questions? Contact our Success Desk.