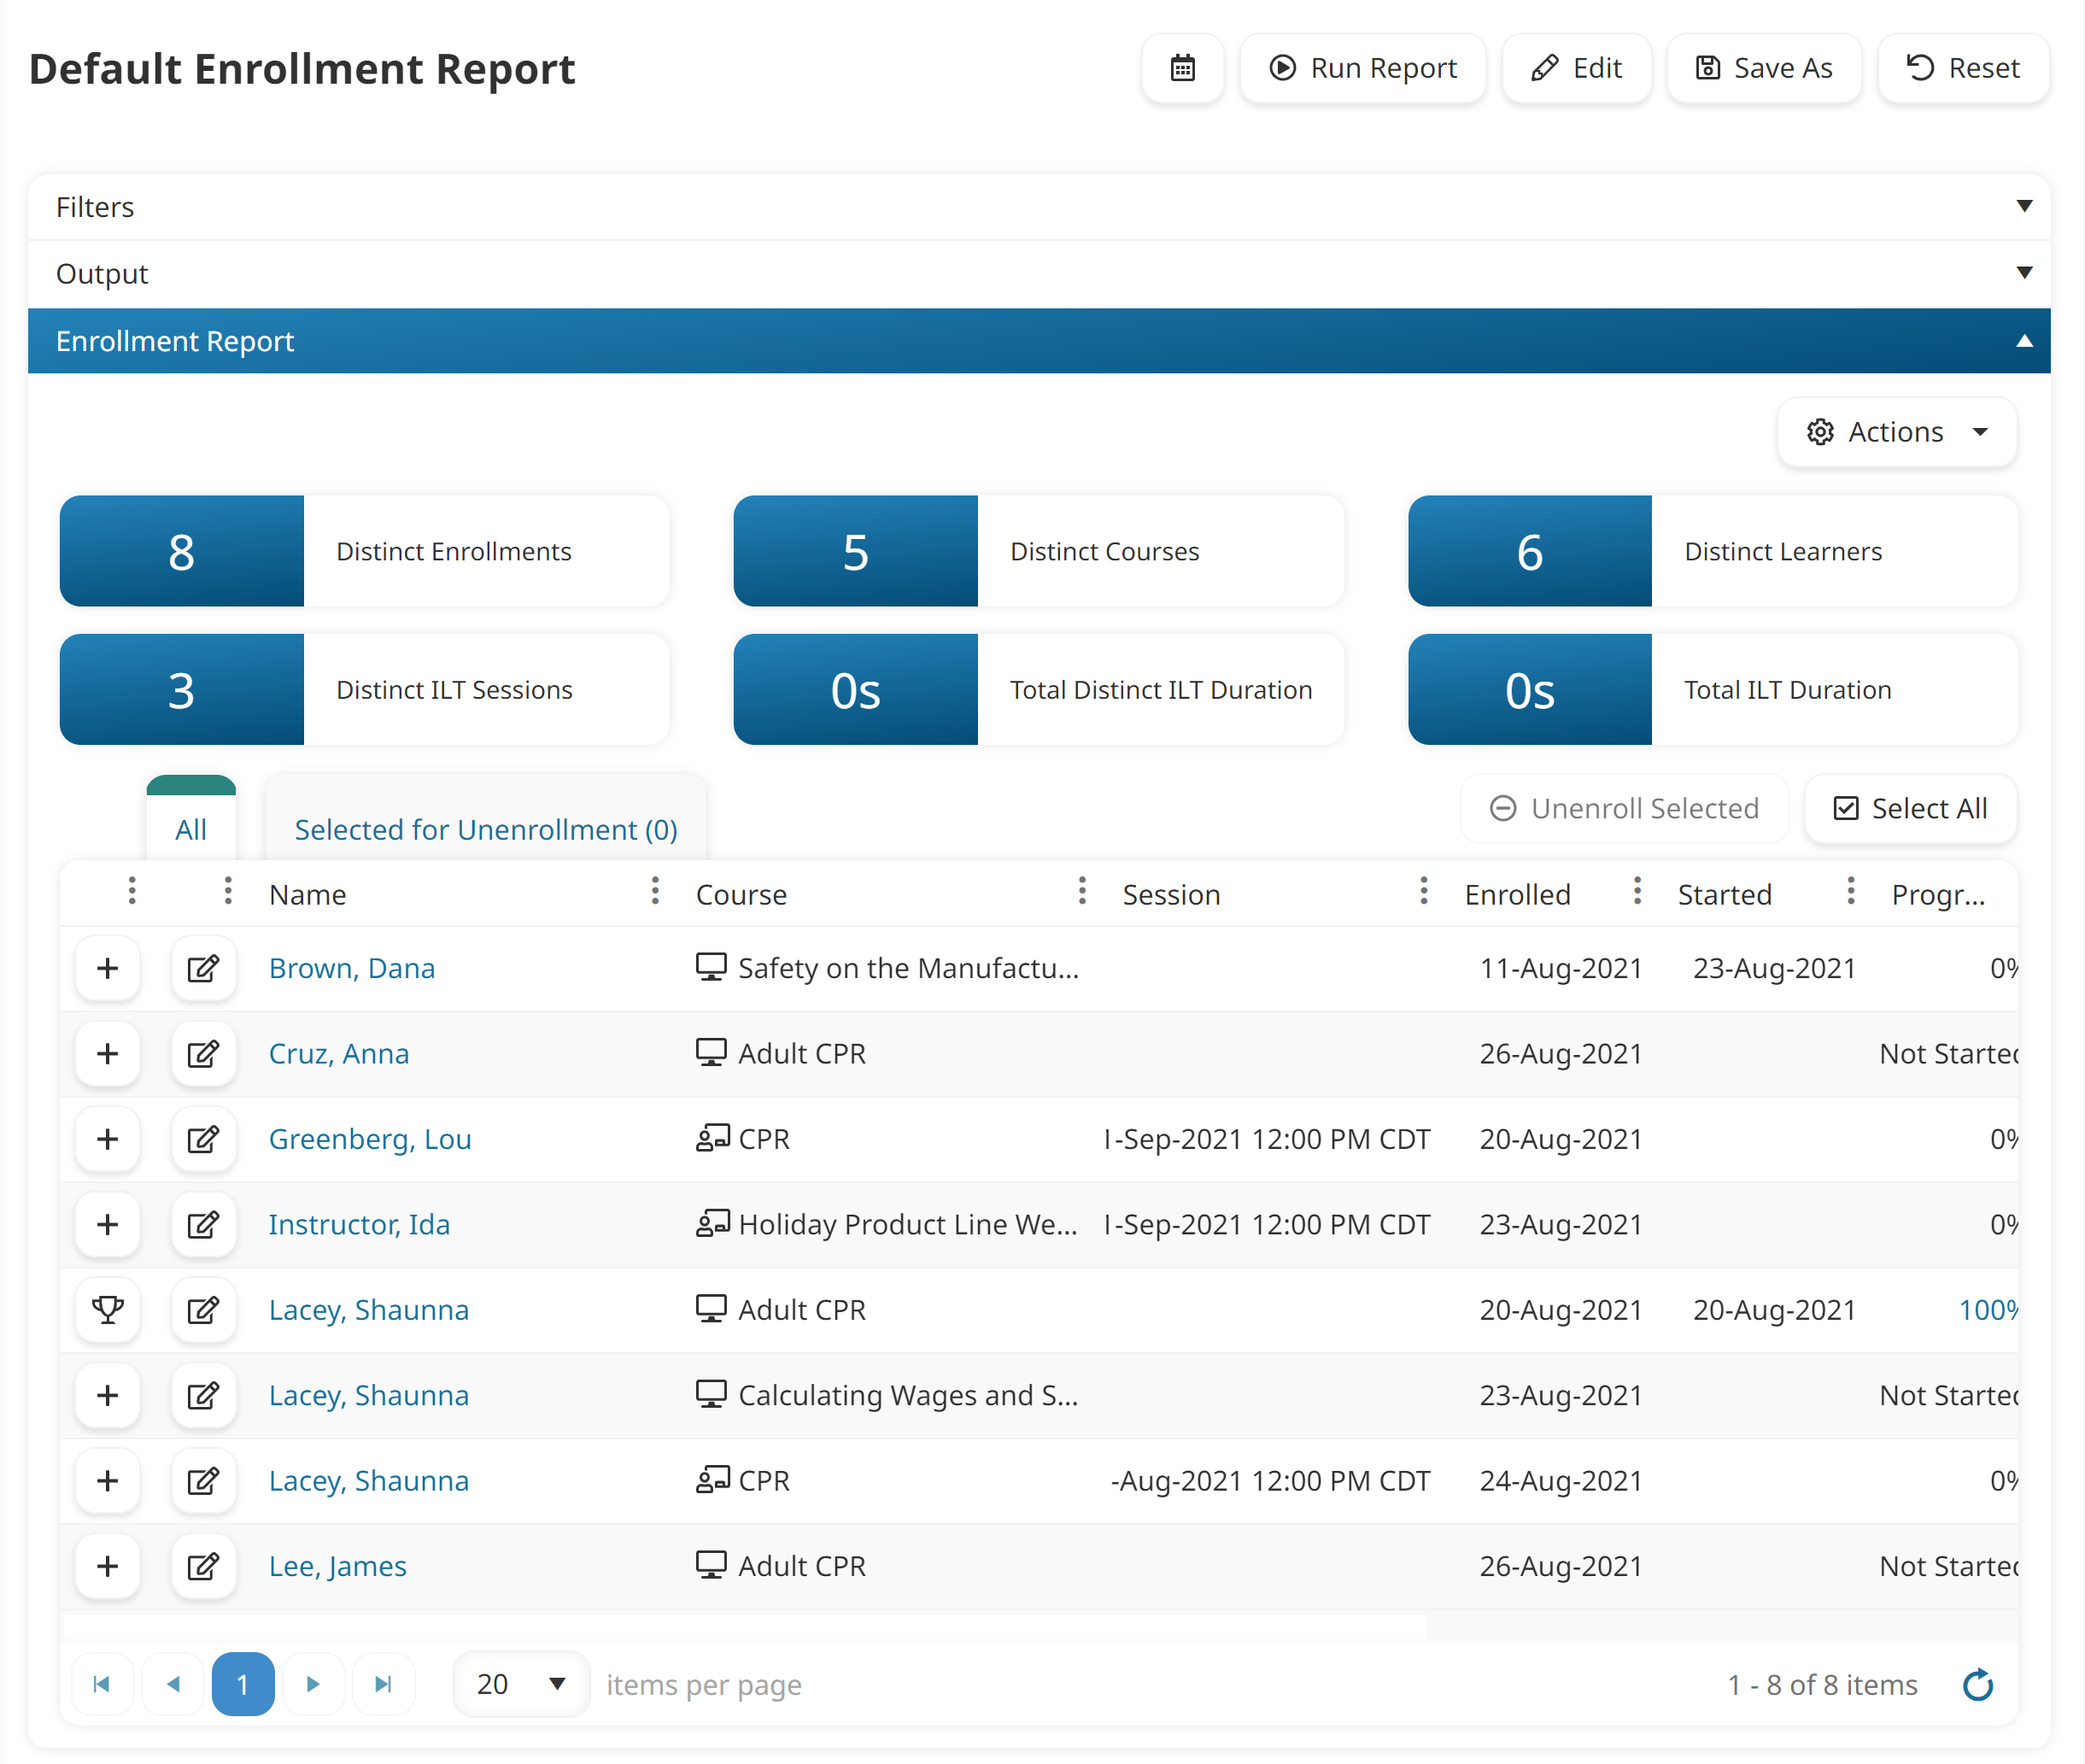
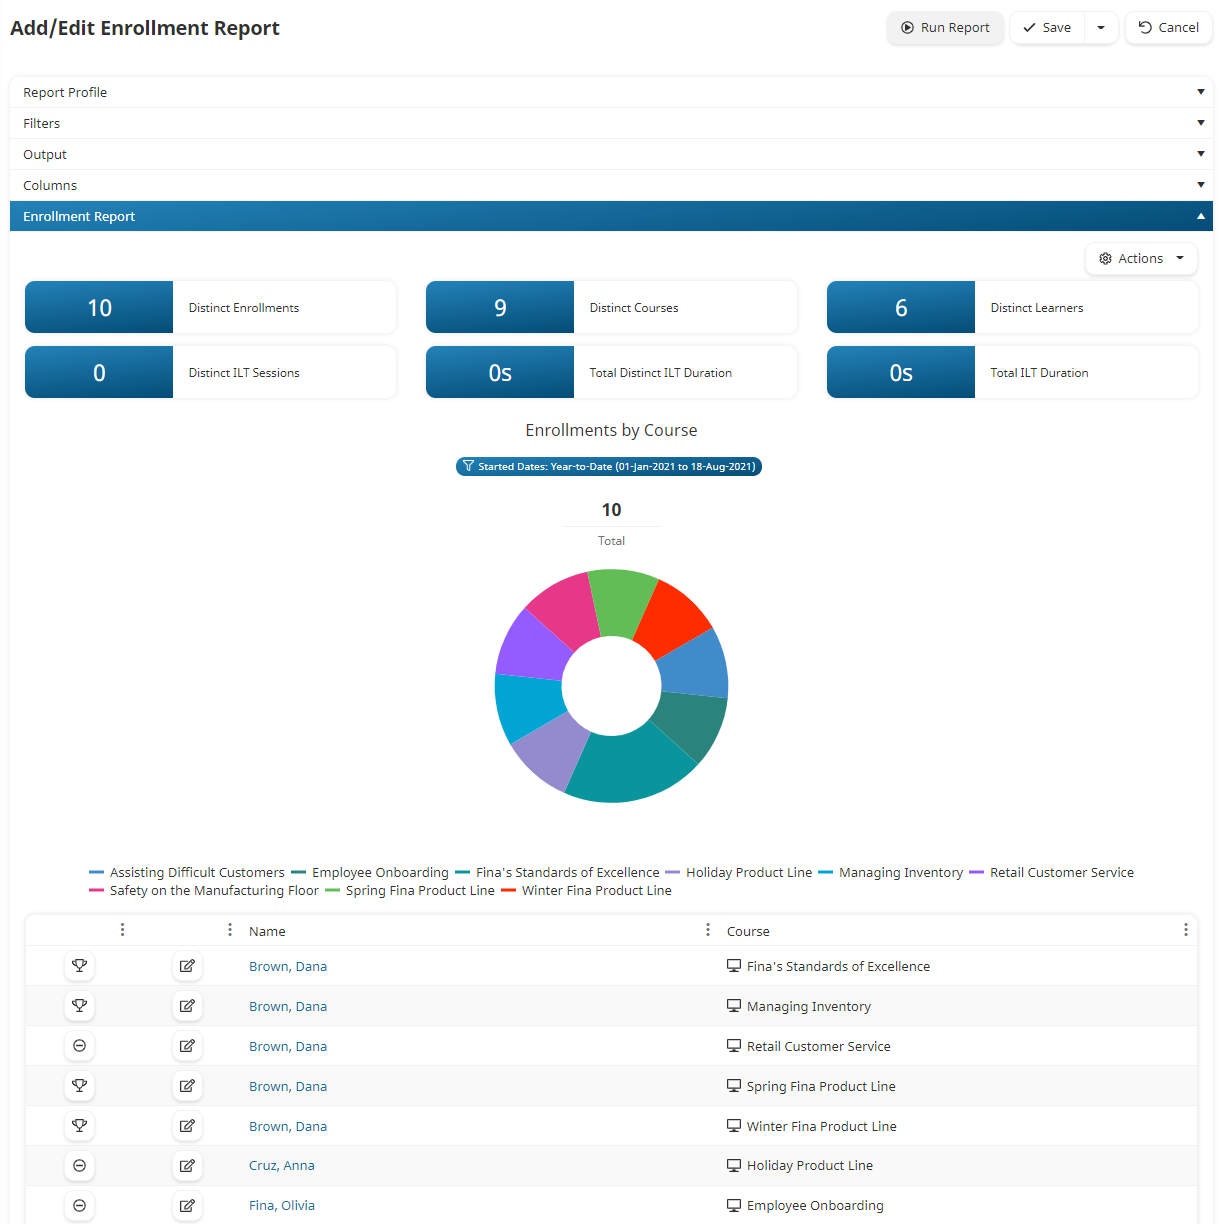
The Enrollment Report enables you to view the progress of learners enrolled in any of your courses.
SmarterU includes a default Enrollment Report with a pre-defined set of filters and columns. A number of SmarterU dashboards link to the default Enrollment Report. Refer to the Default Enrollment Report page for details on the default report's output.

You may also create a custom Enrollment Report if you want to control the report's output columns, filter columns, which filter values may be edited by users, and how your output displays (i.e., grid, chart, or both).

Refer to the Default vs. Custom Enrollment Reports section to compare the features available with each.
Use the Reports Dashboard to add, run, or export an Enrollment Report.
Default vs. Custom Enrollment Reports
The following table compares the default Enrollment Report with custom Enrollment Reports.
| Default Enrollment Report | Custom Enrollment Report | |
|---|---|---|
Edit output columns | X | ✓ |
Edit filter values | ✓ You may only edit the filter values of the filter columns included. | ✓ |
Add filter columns | X | ✓ |
Control ability to edit filter values | X | ✓ |
Display output in chart | X | ✓ |
Control visibility | X | ✓ |